Bitcoin’s $643M ETF Outflows Are Not the Signal You Think
Every time BTC dips, the same reflex fires: the ETFs bled money, institutions are walking away, the cycle is over. Friday delivered the perfect ammunition. Spot BTC ETFs in the United States lost roughly $643 million in a single session, according to CoinDesk, and the follow-up narrative wrote itself before the closing bell.
Here is the problem with that narrative: it is drawn from one number in a series that measures fund flows, and it is being used to explain a price that is set by something else. The $643 million figure is real. The conclusion bolted onto it is not supported by the rest of the tape.
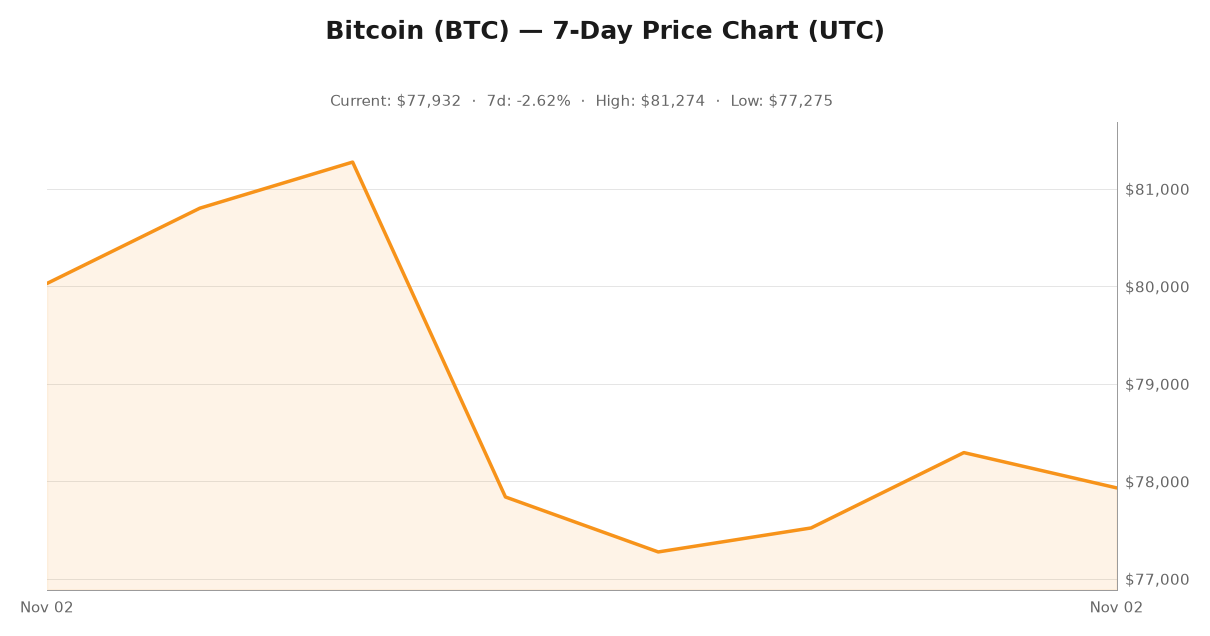
Below is what the data actually shows as of November 2, 2026, plus the four measurements that would justify a genuinely bearish read on the asset.
What $643 Million Actually Buys You
Run the arithmetic before you run the narrative. At the current price near $77,900, $643 million is roughly 8,250 bitcoin. That number matters more than it looks at first glance:
- That haul is about 0.04% of the 20,105,365 coins in circulation. It would not move a market where the marginal buyer sets the price.
- It is roughly 18 days of new issuance. The network mints about 450 coins per day, so one Friday of redemptions equals a bit more than two and a half weeks of everything the protocol will ever produce, sold at once.
- It is about 3.8% of a single day of spot volume. Global 24-hour spot turnover was running near $16.9 billion. Anyone reading a $643 million print as a regime change should be honest about the size of the print.
None of this means the outflow is meaningless. It means scale is the first checkpoint, not the last one.
Fact One: This Is Arithmetic, Not Capitulation
Bitcoin has had a strange year. It opened 2026 around $87,575, peaked at $96,899 on January 15, then slid to $58,566 by July 1 — a 39.6% drawdown inside five months. Off that July low it rallied roughly 48% into a September 22 high of $86,597. Since then it has drifted sideways: down 8.0% over 30 days, down 2.6% over seven, still up 21.7% over 90.
So which is it? Bear market or bull market? Both descriptions are true, and the Friday outflow belongs to the second one. Anyone who bought between July and September was sitting on gains of roughly 25% to 45%. Some of them sold. That is what a rally is for. The interesting question is whether the buyer left — and the evidence below says the seller did.
Fact Two: Volatility Collapsed While the Outflows Happened
This is the number that kills the panic story. Computed from daily closes, bitcoin’s realized volatility is running near 28.1% annualized over the last 30 days, versus 38.6% over 90 days and 43.8% over the trailing year.
Forced selling needs volatility. Liquidations need volatility. A genuine distribution needs volatility. What actually happened on Friday was redemptions into the lowest volatility regime of the past year. Outflows without a volatility spike is the signature of inventory reshuffling, not a change of heart by the marginal holder.
Fact Three: The Money Did Not Leave Crypto. It Left the Wrapper.
This is the part of the tape that should have been the headline. Over the same 24-hour window:
- Total crypto market cap fell about 2.8% to roughly $2.60 trillion.
- Bitcoin’s dominance rose to about 59.96%.
- Ethereum was green near $2,285 (+0.7%), while bitcoin was flat to slightly negative at roughly $77,900.
- Solana sat near $94, down about 1.4%.
If institutions were abandoning the asset class, dominance would be falling on the day the aggregate market shrank. Instead crypto got smaller and bitcoin took a larger share of what was left. A redemption from an ETF wrapper is not a vote against the underlying asset; it is very often a registered advisor rotating the position into a different vehicle, a basis trade unwinding, or a market maker’s arbitrage book resetting.
Flow data is also a lagging series by construction. It reports decisions that were already made. Price and volatility are the outputs. Treating a flow print as a leading indicator is how people end up explaining the past with the present and calling it foresight.
There is a second-order point worth making. ETF flows are a quantity measure, and quantity measures get over-read whenever prices move. The flow tape tells you how much pushed through one channel on one day. It does not tell you what the whole market believes. Price is set by the marginal trade across every venue on earth — spot, perps, futures, ETF shares, offshore books. A single channel carrying under 4% of a day’s turnover is a weather report, not the climate.
The Four Numbers That Would Change My Mind
I am not arguing that bitcoin is immune to a real bear market. I am arguing that this particular headline is not one, and these are the numbers that would tell you it was:
- Realized volatility breaking back above 40% annualized. That would be a regime change. At 28% against a 43.8% trailing-year baseline, sellers have neither leverage nor urgency.
- Hash rate and difficulty rolling over. Network difficulty has posted consecutive increases of roughly 5.9% and 5.5%, and hash rate is running near 1,050 to 1,130 EH/s. Miners are still committing capital through a 38% drawdown from the $126,080 all-time high. The first materially negative difficulty adjustment, with hash rate falling alongside it, would be hard evidence of miner capitulation — and it has not happened.
- Outflows that persist instead of spike. One Friday is a headline; five consecutive sessions is a trend. The daily numbers are tracked in the public spot bitcoin ETF flow tables, and persistence matters far more than magnitude.
- A break of the July low at $58,566. Until that floor is in play, bitcoin is trading 38.1% below its all-time high inside a range it already survived once in 2026. A drawdown is not a regime change. Only the floor decides that.
Where Bitcoin Stands on November 2, 2026
The full scoreboard for anyone who wants the raw inputs:
- Price: about $77,900
- 24 hours: -0.1% | 7 days: -2.6% | 30 days: -8.0% | 90 days: +21.7%
- 2026 to date: -11.0% | From the $126,080 all-time high: -38.1%
- Dominance: 59.96% | Total crypto market cap: $2.60 trillion
- Circulating supply: 20,105,365 bitcoin, which is 95.7% of the 21 million cap
- Transaction fees: still around 1 sat/vB, so the security budget remains almost entirely subsidy-funded. That is a separate problem and deserves its own post.
Live pricing for the above sits on CoinGecko’s bitcoin page, and network and mining data is on mempool.space.
What I Would Actually Do With This
If you are long-term, the ETF flow tape is entertainment, not input. Institutional sellers exit for reasons that have nothing to do with their opinion of bitcoin — rebalancing, redemption windows, basis unwinds, tax lots, mandate drift. Those flows tell you what a shelf of ETFs did on a Friday. They tell you almost nothing about the marginal buyer who sets the price.
Watch the four numbers instead: realized volatility, hash rate and difficulty, the persistence of outflows, and the $58,566 floor. If they stay intact — and as of today they are — then a $643 million Friday is what a healthy bitcoin rally looks like from the inside. Somebody took money off the table while the network kept mining, the hash rate kept climbing, and the market kept its nerve.
The most expensive mistake in crypto right now is confusing a redemption with a rejection. The funds that left were selling a wrapper. The bitcoin did not go with them.
For informational purposes only. This is not financial advice.