Every day, one number gets more attention than any other in crypto: net flow into US spot Bitcoin ETFs. It is treated like a real-time referendum on demand. When it turns green, Bitcoin is supposedly being supported. When it turns red, the exit door is supposedly being opened.
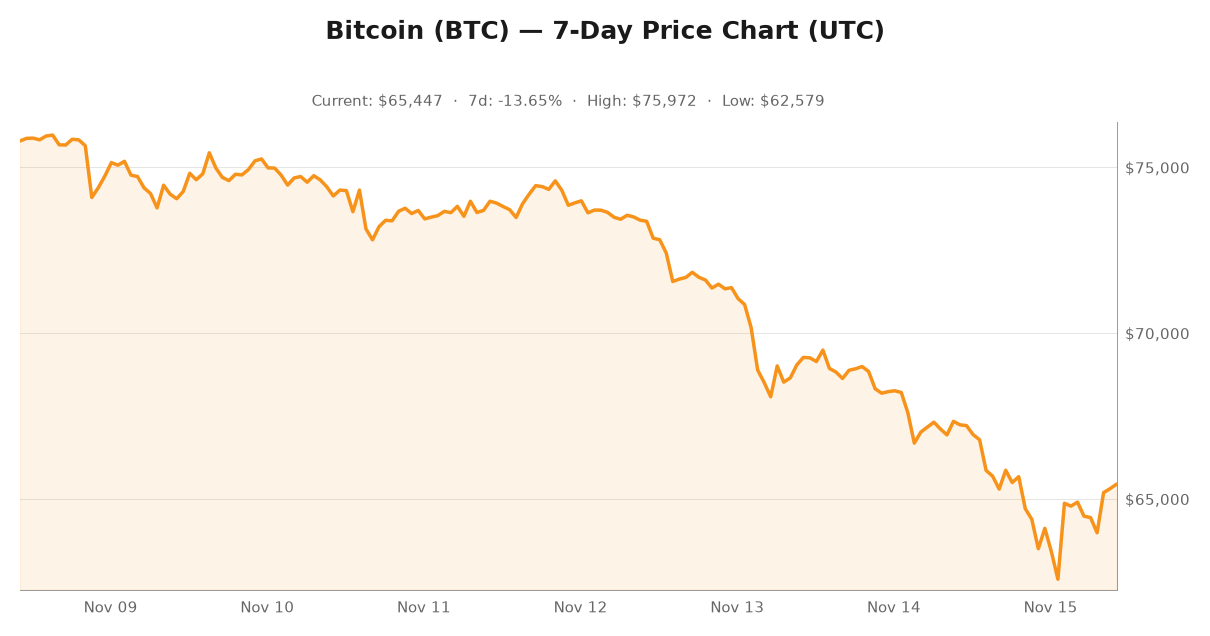
As of mid-November 2026, that headline has gone red and stayed red. The most recent session with data, Friday November 13, marked the 13th consecutive trading day of net outflows, and the cumulative figure for the year has flipped negative for the first time in the product’s history. Bitcoin is trading near $64,119, down about 21.9% over 30 days and roughly 48.6% below its October 2025 all-time high of $124,777.
The reflex explanation is that ETF outflows are dragging Bitcoin down. The flow data supports something less dramatic and more interesting. Across 730 trading sessions of spot Bitcoin ETF history, the net number has quietly stopped describing accumulation. What it describes now is churn.
The headline went negative for the first time
Pull the daily table from Farside Investors, the standard reference for these numbers, and the annual picture is stark:
- 2024: +$35.25B net flow, $59.47B gross flow, 1.7x turnover
- 2025: +$21.35B net flow, $73.14B gross flow, 3.4x turnover
- 2026 through November 13: -$1.89B net flow against $53.15B gross flow
Three years, three different stories
Day counts are just as revealing. In 2026 there were 109 sessions with net inflows and 110 with net outflows, with no flat session in between. This is a market where the sign of the daily flow was a coin flip, and the coin came up tails by $1.89B. The monthly detail shows how violent the whipsaw was: June gave back $4.51B, August took in $3.54B, September added $2.65B, and November through the 13th has bled $2.35B across only 10 sessions.
Nowhere in that sequence is there a regime shift you could trade on. There is a stream of noise with a small negative drift.
Gross turnover is the number that matters now
Here is the reframe. In 2026, investors moved $53.15B through the Bitcoin ETF wrapper while the net result was -$1.89B. That is a turnover multiple of roughly 28x. The same wrapper turned over 1.7x in 2024 and 3.4x in 2025.
What that means is mechanical rather than mysterious. Every dollar that enters one fund and exits another shows up in the gross figure and nets to zero. The wrapper has become a venue where existing holders shuffle Bitcoin between vehicles, not a channel that carries new capital into the asset. Average daily gross flow in 2026 was $243M, remarkably stable against $234M in 2024 and $285M in 2025, even as the net flipped negative.
That makes the green-or-red total the least informative number in the table. It tells you that a coin flip landed tails.
In Bitcoin terms, the wrapper shrank while the price fell
Convert the dollar flows into Bitcoin and the picture sharpens. Valuing each session’s net creations against that day’s close on the Blockchain.com price series, the ETF complex has accumulated roughly 681,000 BTC since January 2024. Against a circulating supply of about 20.11 million Bitcoin, that is 3.39% of every coin in existence, equal to about 4.2 years of mining at the current rate of 446 BTC per day.
The flow direction in 2026 has been the other way. Net creations of roughly 14,300 BTC in 2024 and 184,800 BTC in 2025 became a net redemption of about 25,400 BTC in 2026, the equivalent of 15.6% of a full year of mining output leaving the wrapper instead of joining it.
Then there is the number that explains the whole situation. The complex’s cumulative net creations total $54.70B, which is roughly the cost basis of the Bitcoin it holds. Marked to the current $64,119, that position is worth about $43.68B, putting it approximately $11.03B underwater, or 20.2% below cost.
This is the mechanism most commentary misses. Holders inside the wrapper are sitting on a 20% loss, which leaves them little incentive to add and every incentive to wait. The marginal bid that the ETF story was supposed to provide has been replaced by a marginal supply of sellers anchored to cost basis.
Price action: flows are coincident, not leading
Why the daily number does not predict anything
The other claim worth testing is that ETF flows lead price. The daily data does not support it.
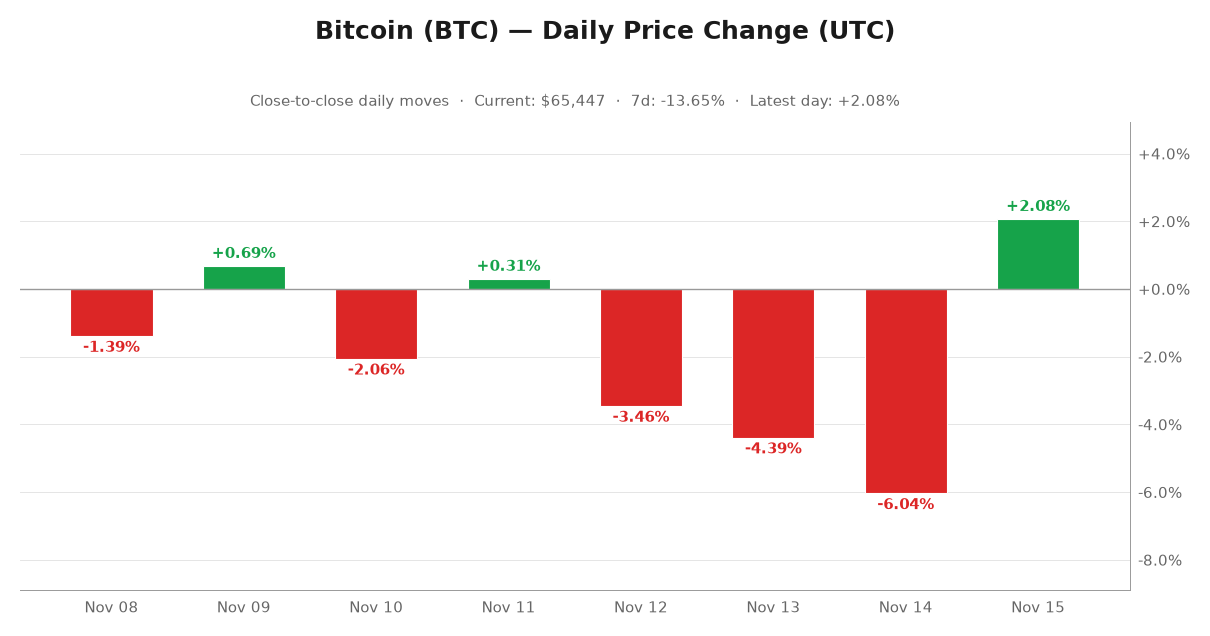
Across the 219 trading sessions of 2026, the correlation between a day’s net ETF flow and that day’s price move is +0.001. Against the next day’s move it is +0.003. Both are indistinguishable from zero. If daily ETF flows carried genuine predictive power for returns, you would expect something in the 0.1 to 0.2 range at least. There is nothing there.
Monthly data is where any relationship becomes visible, and even there it reads as coincidence rather than causation:
- August 2026: +$3.54B net flow, Bitcoin +22.4%
- June 2026: -$4.51B net flow, Bitcoin -18.3%
- November through the 13th: -$2.35B net flow, Bitcoin -8.8%
- March 2026: +$1.32B net flow, Bitcoin +1.4%
Read that carefully and the flows look like a coincident, lagging reflection of price action rather than a leading indicator. Money tends to arrive after a move and leave after a move, which is exactly what a daily correlation of zero alongside a monthly relationship that shows up in both directions would produce. Trading the headline flow as a leading signal means trading the wrong end of the sequence.
The outflow is mostly rotation, not exodus
Aggregating by fund for 2026 shows what the headline hides: only three of the twelve US spot Bitcoin ETFs posted positive net creations. BlackRock’s IBIT took in $2.10B, Grayscale’s BTC product took in $0.96B, and MSBT added $0.87B. Against that, GBTC lost $2.89B, FBTC lost $1.96B, and ARKB lost $0.72B.
Cumulative figures since launch sharpen the point. IBIT’s net creations total $64.19B, more than the entire complex’s net inflows of $54.70B, precisely because GBTC has given back $28.15B over the same period. Strip out the legacy funds under persistent redemption pressure and the picture is mildly constructive, not exodusary.
So when a headline says Bitcoin ETFs saw outflows, it frequently means a legacy fund with structural redemption pressure sold and the proceeds landed in a different fund. The Bitcoin did not leave the building. It changed vehicles.
What would actually change my mind
Four tests worth running against the daily table
- Breadth. Five or more of the twelve funds with positive net creations for 2026, up from three. That would mean demand is broadening instead of concentrating in a single issuer.
- Duration. Four consecutive weeks of positive net flow. A 13-session outflow streak is noise. A month-long streak is positioning.
- Flow quality. Gross daily churn falling below roughly $150M while net stays positive. That combination means new money is arriving without a matching exit, which is actual accumulation inside the wrapper.
- Price confirmation. Positive net flow while Bitcoin holds above the $77K to $83K range it occupied through September and October. Flows plus price make a trend. Flows against a falling price make a dip-buying exercise.
The bottom line
The narrative that ETFs are a structural bid for Bitcoin has not been disproven. The wrapper still holds roughly 3.4% of every Bitcoin in existence, and it held that share through a 48.6% drawdown from the all-time high. What has changed is marginal behavior. In 2026 the ETF channel stopped adding net Bitcoin, the flows that remained were largely rotations between funds, and the position itself sits about 20% below cost basis.
The right thing to watch is therefore not whether tomorrow’s number prints green. It is the spread between gross and net, the breadth across funds, and whether redemptions keep pace with creations. Right now the wrapper is churning hard, the breadth is thin, and the average holder inside it is underwater. That combination does not describe accumulation. It describes a large pool of Bitcoin changing hands inside a wrapper while waiting for a lower price.
Bitcoin sits near $64,119, down from $124,777 in October 2025, with ETF wrappers holding roughly 681,000 coins between them. For live supply, dominance and volume data on the underlying asset, CoinGecko’s Bitcoin market page tracks it, and the daily flow series on Farside Investors is the number to check when the headline comes back around.