Bitcoin’s 36% Drop Isn’t a Capital Flight. It’s a Freeze.
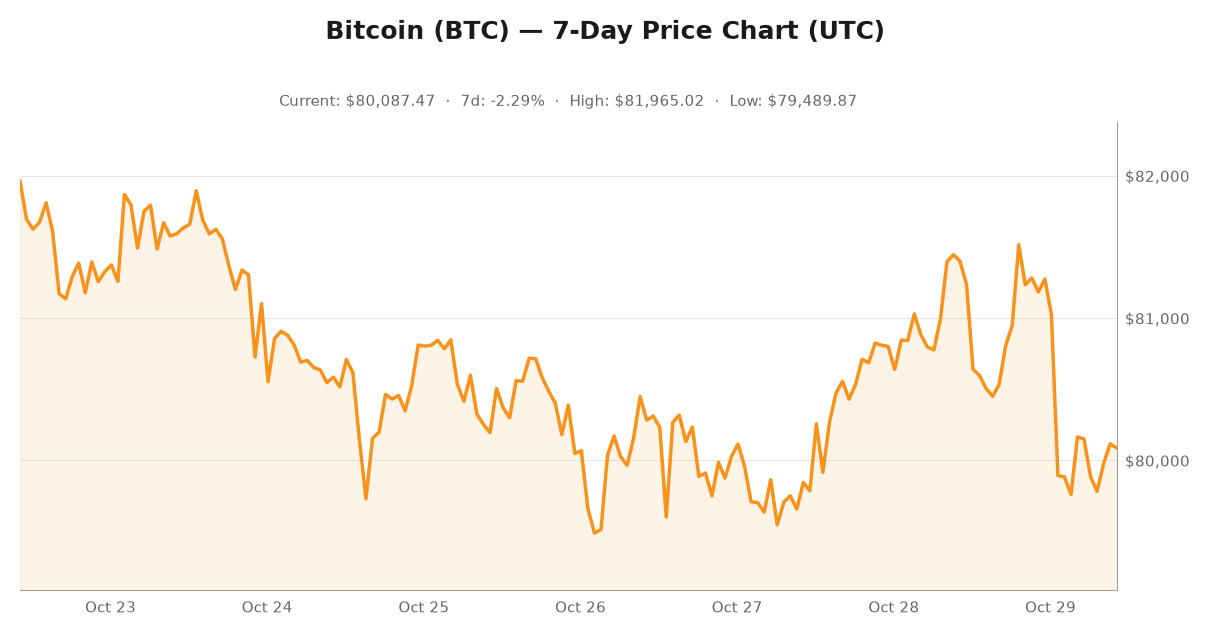
Bitcoin trades just above $80,100 as of October 29, 2026, roughly 36% below its $126,080 all-time high and about 27% lower than it was twelve months ago. Bitcoin’s market capitalization has fallen from around $2.20 trillion a year ago to $1.61 trillion today, a loss of roughly $585 billion in dollar terms. That is the number the market stares at, and it is the number that gets explained with the usual line: demand is gone, capital left, the buyer who was supposed to arrive never showed up.
There is a second number, and it does not look like that. The total supply of dollar-pegged stablecoins across every blockchain sits at about $300.3 billion right now. A month ago it was $306.4 billion. A year ago, on this very date in 2025, it was $305.4 billion. Over the same twelve months that Bitcoin shed roughly $585 billion of market value, the dollar float parked inside crypto moved by less than 2%.
That distinction is worth more than a hundred market commentaries, because it kills one popular theory and quietly confirms another. If capital had genuinely fled crypto, the stablecoin float would have drained into bank accounts the way it drained in previous cycles. It did not. What happened is quieter and, for anyone waiting on a bottom, arguably worse: the cash arrived, and then stopped. Bitcoin’s drawdown looks less like an exodus and more like a freeze in the flow of new dollars.
What $300 Billion in Stablecoins Actually Says
Stablecoin supply is the cleanest available proxy for settled, spendable, dollar-denominated capital inside the crypto system. It is not perfect — some of it is exchange float, some is collateral, some is parked by entities that will never deploy it. But it is directly countable, it updates daily, and it moves before or alongside prices.
Here is the record of the last twelve months on the crypto system’s cash side:
- Today: roughly $300.3 billion of dollar-pegged stablecoins in circulation.
- Seven days ago: $303.7 billion, down about 1.1% from here.
- Thirty days ago: $306.4 billion, down about 2.0%.
- Ninety days ago: $298.5 billion, so the float is slightly higher than it was in late July.
- One year ago: $305.4 billion — only 1.7% above today’s number.
Now put that next to Bitcoin’s own ledger. In the same twelve months, Bitcoin’s market cap went from $2.20 trillion to $1.61 trillion. Total crypto market cap is $2.70 trillion as of this morning, down about 4.1% in a single day. Bitcoin dominance sits at 59.5%, with Ethereum at 10.5% and USDT alone at 6.7%. CoinGecko’s global market data confirms the same picture from a different angle: risk assets repriced hard, and Bitcoin took the least damage among the majors.
So which story is right? The “capital left crypto entirely” story is wrong. A float that only shed 1.7% while the headline asset lost $585 billion is not a flight; it is a stall. But the “new capital is pouring in” story is wrong too, and this is where the uncomfortable part begins: the float is not growing, and a market that cannot issue new dollars has no marginal buyer coming.
Where the $300 Billion Sits — and Why Bitcoin Is Not on the List
The composition of that float matters more than its size. DefiLlama’s stablecoin dashboard breaks it down by chain, and the distribution reads like a map of where crypto activity actually happens:
- Ethereum: $141.3 billion, or about 47% of the entire global float.
- Tron: $93.6 billion, roughly 31%.
- Solana: $15.3 billion, about 5%.
- Base: $4.99 billion and Arbitrum: $3.58 billion.
- Bitcoin: effectively nothing. Bitcoin’s own chain holds no material native stablecoin supply in this data.
That last line is the one that should make you stop. The corporate Bitcoin treasury story has dominated headlines all year, and it is genuinely large — Bitcoin-native ecosystem TVL sits around $6.2 billion per DefiLlama — but it is the small table at the back of the room. Every dollar that touches Bitcoin as liquidity touches Ethereum or Tron first. Bitcoin does not have its own dollar float. It borrows one.
That is not a criticism of Bitcoin; it is a description of how settlement layers work. But it does mean the usual instinct — watch spot Bitcoin ETF flows to know when Bitcoin’s bid returns — is incomplete. A large share of the money that eventually becomes a Bitcoin bid arrives as stablecoins, gets funded on Ethereum or Tron, and sits there until someone deploys it. So the leading indicator is one step earlier than the ETF tape.
The Float Is Also Concentrating in One Issuer
Issuer concentration has tightened further this year. Tether holds about $180.8 billion, or 60% of all dollar-pegged supply, and Circle’s USDC holds about $71.3 billion, or 24%. Everyone else shares the remaining 16%:
- USDS (Sky Dollar): $6.6 billion
- DAI: $4.7 billion
- Ethena USDe: $4.5 billion — the largest crypto-native dollar, collateralized rather than bank-backed
- World Liberty USD (USD1): $3.9 billion
- Global Dollar (USDG): $3.07 billion
- PayPal USD (PYUSD): $2.97 billion
The bank-issued challengers are all growing, and one of them is now large enough to matter. But a float where six in ten dollars sit in a single issuer’s balance sheet carries issuer-specific risk that a diversified float would not. Blockchain.com’s on-chain charts also show Bitcoin’s UTXO count at 165.6 million, down from a 167.5 million high ninety days ago: coins are being consolidated into long-term storage rather than circulated, which is the same message the float is sending in a different currency.
The On-Chain Tape Says the Same Thing: Parking, Not Transacting
If the stablecoin float were simply waiting for a Bitcoin rally, Bitcoin’s own network activity would be rising alongside it. It is not. Over the past thirty days, CoinDesk’s Bitcoin coverage has tracked a market that is settling less, not more:
- Daily transactions: 642,252, down 17.7% in thirty days.
- Daily settled volume: $9.23 billion, down about 38% — roughly $5.7 billion a day of vanished throughput.
- Daily transaction fees: $210,131, down 30%.
- Daily miner revenue: $41.3 million, down 15%.
- Hash rate: about 1,006 EH/s, down 8.8% in twenty-four hours and 7.6% in thirty days.
That last number is the tell. Hash rate fell nearly 9% in a single day while network difficulty has not moved at all — it still sits at a record 140.58 trillion. Miners are switching off or selling hashpower into a difficulty that assumes they are still running. That usually resolves one way: a sharp difficulty reset, followed by whichever operators survive it capturing a larger share of a smaller pie. Watch the miners, not the memes.
Ethereum Holds the Float While Its Own Token Bleeds
One more layer deserves attention, because it inverts the usual assumption that Ethereum’s weakness is bad for crypto liquidity. Ethereum holds 47% of the global dollar float and roughly $45.8 billion in total value locked, yet the asset itself trades at $2,318 — down 42% over twelve months and 53% below its $4,946 peak. Ethereum’s daily fees sit near $10 million, with roughly $330 million collected across the last thirty days.
In other words, the chain that settles most of the world’s crypto dollars is the chain whose token is one of the year’s worst performers. That tells you the float is not a bullish bet on the settlement layer. It is working capital. Which is precisely why it can sit flat through a 36% drawdown without triggering a panic — and precisely why it will move first when something changes.
Four Numbers That Would Break the Freeze
Rather than guessing at a bottom, here is a checklist that would tell you the flow has restarted:
- Total stablecoin supply back above $306 billion. That is the one-month-ago level, and the first clean sign that fresh dollars are entering the system rather than rotating inside it.
- Ethereum’s share of the global float pushing past 50%. Settlement concentrating while prices sit still usually precedes a broad risk-on move, not a retreat.
- Daily settled transaction volume recovering above roughly $12 billion from today’s $9.23 billion, with transaction count climbing alongside it rather than just larger transfers.
- Hash rate stabilizing while difficulty stays at 140.58 trillion — proof that miner capitulation has ended and the security budget is intact. Spot Bitcoin ETF flows remain the confirming signal for the Bitcoin leg of the trade.
The Bottom Line
The consensus explanation for Bitcoin’s drawdown is a demand story: the buyers left, the thesis broke, the money went home. The data does not support the money-going-home part. The dollar float inside crypto is essentially unchanged over twelve months, sitting on Ethereum and Tron rather than Bitcoin, and increasingly concentrated in Tether. The network is settling fewer and smaller transactions while hash rate retreats from a record difficulty.
So the honest version of the story is colder than “capital is coming back.” Bitcoin’s 36% decline is a repricing of a market whose cash pile stopped growing while its appetite for risk shrank faster. A freeze ends when the cash starts moving again, and the number that tells you it has moved is the stablecoin float — not the price chart, and not the ETF tape. Follow internetwealthresource.com for daily, data-driven crypto breakdowns, and we will track these four numbers every morning.