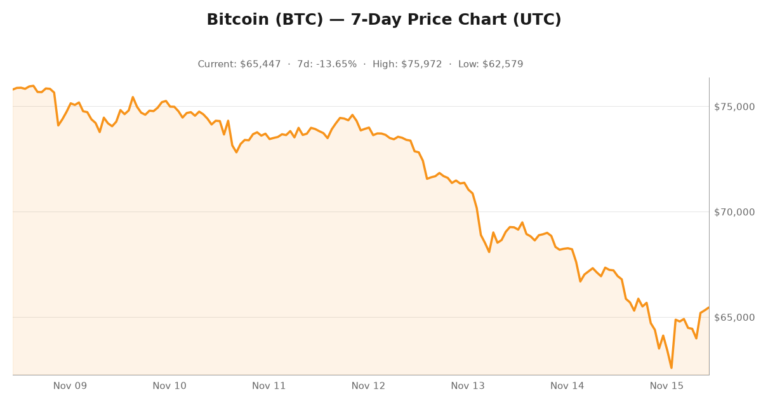
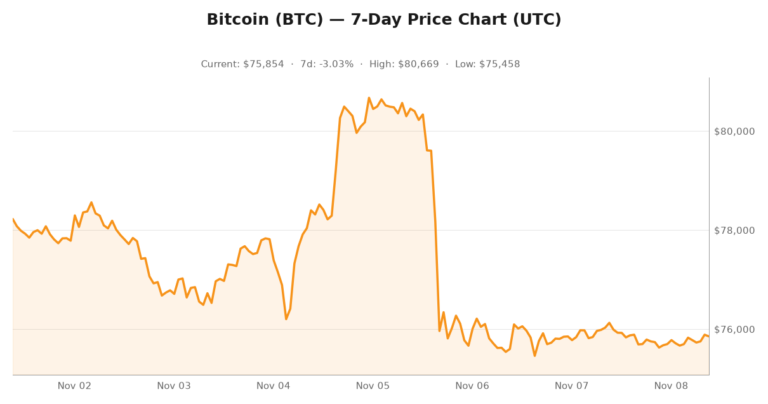
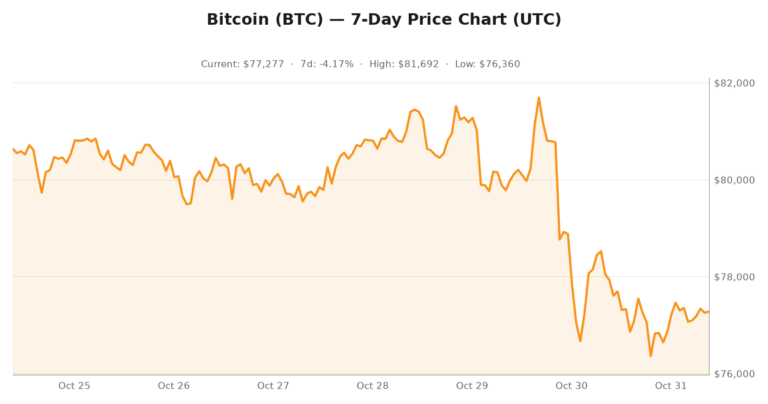
At 08:00 UTC on Saturday, November 21, a Bitcoin buyer on Kraken’s Canadian-dollar pair paid C$24,250 for one bitcoin. At the Bank of Canada’s reference rate that morning, C$24,250 was worth about US$16,900 — a 71% discount to the Bitcoin price trading on the very same exchange, in the very same five minutes, for the very same asset.
Kraken said all orders were processed correctly, found no evidence of a security breach or compromised accounts, and that “executed trades stand.” Blockstream CEO Adam Back suggested a market maker on the USD/CAD spot market may have exhausted its funds, causing prices to diverge from broader foreign-exchange rates, with arbitrageurs then spreading the distortion to other CAD pairs. Kraken has not confirmed that explanation.
Here is the part that matters for anyone who holds or trades Bitcoin: the discount was real, the fills were real, and the Bitcoin price never went there. Pull Kraken’s own five-minute candles and the dislocation shows up in the tape exactly where it should, and nowhere else.
What Actually Printed: One Asset, Two Books, One Minute Apart
Kraken’s BTC/CAD book, 08:00–08:05 UTC on November 21: open C$32,000, high C$44,000, low C$24,250, close C$37,500, and a volume-weighted average of C$26,750 across 323 trades. That bar’s average fill sat roughly 69% below where the same exchange’s dollar book was trading.
Kraken’s BTC/USD book, same five minutes: open $57,879, high $57,900, low $57,652, close $57,661 — a range of about 0.4%. One venue, one asset, one minute apart: one book printed a 71% discount to the other, which is the whole problem with trusting a single quote for the Bitcoin price.
And nowhere else on earth did anything close to $17,000 print. Coinbase’s 24-hour low on BTC-USD was $57,759.61. Bitstamp’s was $57,734.15. Deribit’s perpetual contract bottomed at $57,727.50 and topped out at $61,260. The only $17,000 Bitcoin that existed anywhere that morning was a quote on one thin Canadian-dollar order book — a Bitcoin price print that no other venue could confirm.
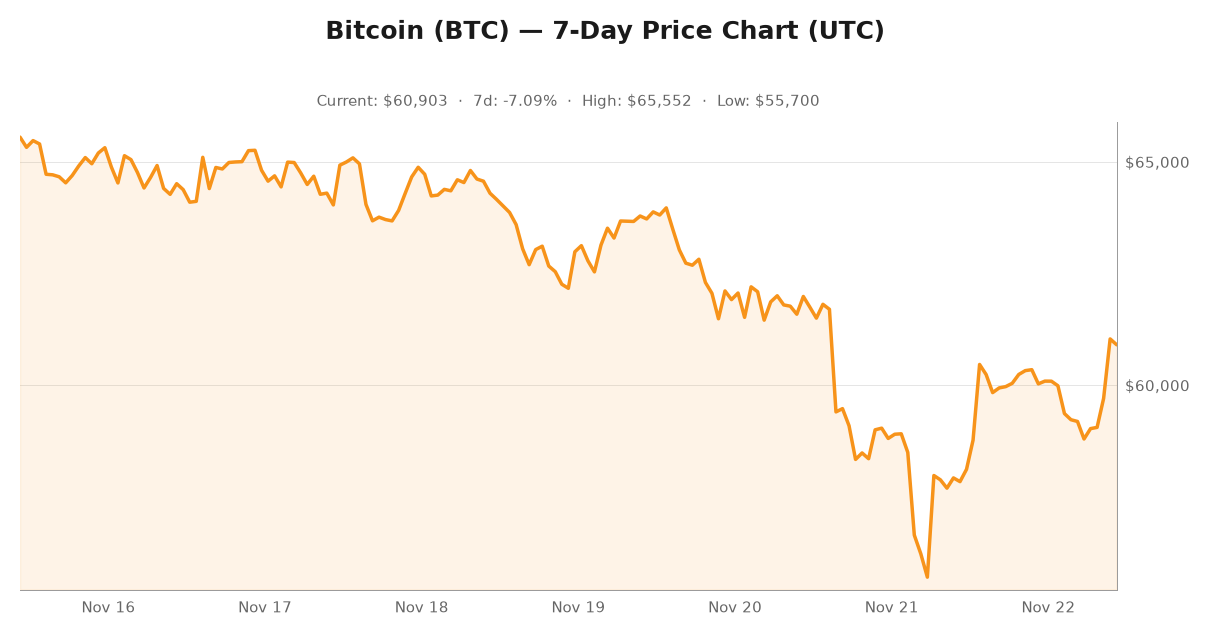
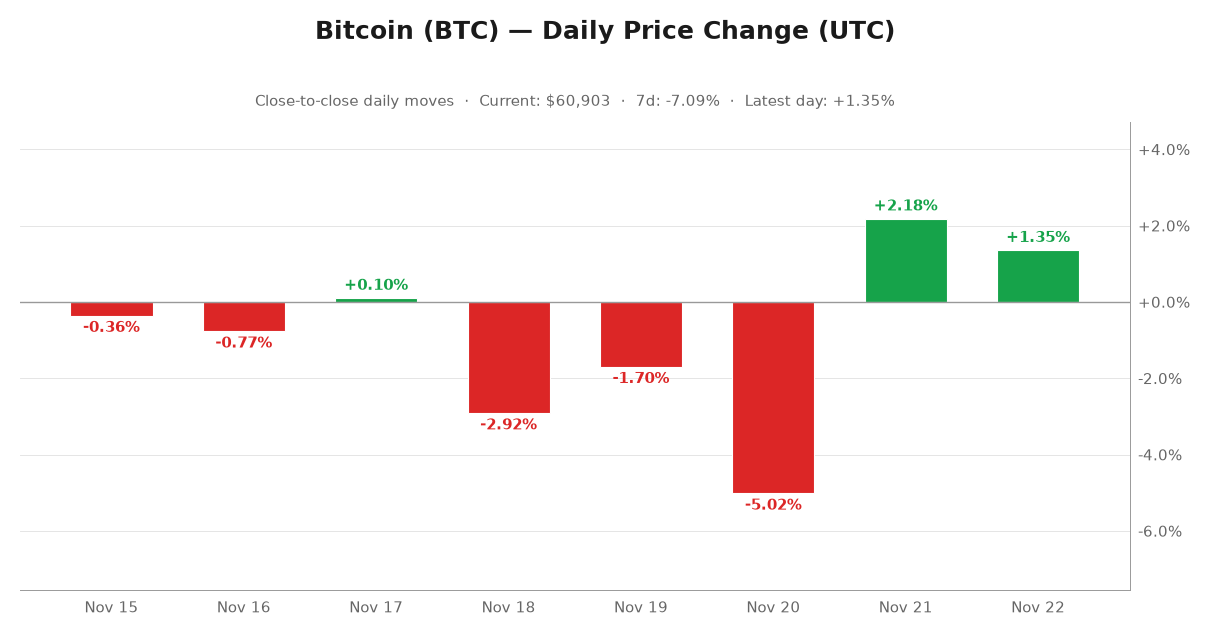
Kraken’s own daily candle tells the rest of it. BTC/USD on November 21 opened at $58,806, wicked down to $55,100 during the tech-led risk-off session, and closed at $60,089. That $55,100 was the worst honest number that day. Seventeen thousand dollars was never on the chart, and no honest Bitcoin price existed at that level.
The 12-Hour Slide: How a Discount Gets From 9% to 71%
The dislocation was not a single stray print. It was a slow, mechanical decay in the CAD book, and the candles show it happening long before the headline did:
- Friday 20:00 UTC — the CAD book prints as low as C$75,000 on 21.5 BTC of volume, about 9% under parity.
- 21:00 UTC — C$61,880, roughly 25% under parity.
- 22:00 UTC — C$57,775, about 30% under.
- 23:00 UTC — C$56,986, about 31% under, on 23 BTC.
- Saturday 08:00 UTC — C$24,250, about 71% under, the bottom.
- 09:45–10:05 UTC — the book climbs back to C$79,500–81,000, within a few percent of parity.
Parity here means the Bank of Canada reference rate: C$1.4325 per US dollar on November 20, C$1.4317 on the 19th, C$1.4326 on the 18th. Multiply the dollar Bitcoin price by 1.4325 and you get what the CAD book should have printed. Every number above is that comparison, and you can pull the exchange rates yourself from the Bank of Canada’s public feed.
Now the volume signature, because this is the detail that separates a plumbing failure from a repricing. On the worst prints the CAD book traded 21.5, 21.4, 17.8 and 23.4 BTC. On a normal day that pair trades about 24 BTC for the entire session — the November 19 daily candle shows 23.93 BTC across 1,572 trades. On November 21 the pair traded 521.79 BTC across 22,247 trades, roughly 22 times the normal daily volume, and 495 of those 521 BTC traded before 10:00 UTC, inside the broken window. The book that was mispricing the Bitcoin price was also being hammered, which is the fingerprint of a stale quote taking real orders rather than a market changing its mind.
Why the Crypto Book Broke When the Forex Book Broke
Bitcoin does not trade in Canadian dollars. It trades in dollars, euros, pounds and a handful of other currencies, and each fiat pair is a separate book with its own liquidity providers. A CAD-quoted Bitcoin book is, mechanically, a dollar Bitcoin book wrapped in a USD/CAD conversion. When the FX leg goes haywire, the crypto leg goes with it — and the Bitcoin price on that pair stops tracking the Bitcoin price on every other pair.
Adam Back’s explanation — an exhausted market maker on the USD/CAD spot market — fits the tape. A maker quoting CAD Bitcoin off a USD/CAD hedge needs that hedge to work. If the hedge goes stale or the maker’s balance sheet is exhausted, the quote it posts stops reflecting either the FX rate or the dollar Bitcoin price. Anyone who lifts that stale quote gets a fill at a price nobody agreed to. Kraken’s statement to Cointelegraph — orders processed correctly, no breach, executed trades stand — points the same direction: a plumbing failure inside a market-making stack, not a compromised system.
Then arbitrage did what arbitrage does, and it is also why the book recovered by mid-morning. Bots bought cheap CAD Bitcoin and sold it elsewhere, pulling the quote back toward parity. The same mechanism that spread the distortion across other CAD pairs, per Blockstream, is the mechanism that repaired it. Bitcoin liquidity, thin as it is, self-corrected inside roughly two hours once arbitrageurs arrived with balance sheet — and the Bitcoin price on that book rejoined the rest of the market within a whisker of parity.
Who Ate the Other Side of a 71% Discount
Because Kraken stands behind executed trades, the fills are real. Buy at C$24,250 at 08:00 and sell at C$79,500 at 09:45 is a 228% gain on a 105-minute trade, in a market where the same asset had traded at a 71% discount minutes earlier.
Which means somebody ate the other side of that fill at roughly US$40,000 per bitcoin. If the counterparty was a stale-quote maker on Kraken’s own book, the venue absorbed it. Kraken has not said how it is handling the loss, and has not confirmed the market-maker exhaustion theory. It said the trades stand, which means the Bitcoin price those trades settled against was real money at a price the market never agreed to.
Here is the part that is easy to miss: this is a classic flash-crash mechanism without the cascade. A stale quote plus a market order equals a fill nobody wanted. Thin books do not need a fat finger or a hacker to produce that — they need one liquidity provider whose hedge breaks while somebody else is willing to take whatever is offered.
The difference between $17,000 and a real liquidation spiral is what happens next, namely whether the wrong price feeds automated liquidations on the healthy books. On this occasion it did not. The week’s genuine Bitcoin stress — a break below $60,000 and a fear gauge at its worst since February — happened in the dollar books and looked like an ordinary risk-off move, and the Bitcoin price recovered into the weekend. Next time a wrong Bitcoin price print could land on top of leveraged positioning, and the same plumbing that repriced one thin book would carry the damage into the healthy ones.
Where the Real Bitcoin Price Gets Found
Compare the two books on Kraken right now. Within 1% of the mid, the BTC/USD book holds roughly 251 BTC on the bid (about $15.2 million) and 258 BTC on the ask (about $15.7 million) across hundreds of price levels, with a spread that rounds to zero. The BTC/CAD book holds about 3 BTC on each side, roughly $255,000 bid and $231,000 ask, across 30 levels a side, at an 11.5 basis point spread. Rolling 24-hour notional: $222.5 million on the dollar pair, $48 million on the euro pair, $4.6 million on the pound pair, and $1.79 million on the Canadian-dollar pair.
That ratio — about 124 to 1 in favor of the dollar book — is why the Bitcoin price never moved. The dollar book is where the size is, so the dollar book is where the price is. The CAD book is a rounding error with an FX dependency attached, and when that dependency breaks, the rounding error prints the news.
Broader context on Sunday: Bitcoin trades near $60,800 to $61,100 depending on venue, up roughly 5% on the day, with total crypto market cap near $2.07 trillion and Bitcoin dominance at 58.8%. The fear and greed gauge hit its worst reading since February during the week and has been recovering with the tape. None of that is affected by one Canadian-dollar print, and any Bitcoin price headline built on that print was measuring the wrong book.
Three Things to Take From a $17,000 Bitcoin Print
- Price Bitcoin off deep books or an index, not off one pair. If your terminal draws its Bitcoin price from a CAD pair, you are reading a quote that can be 70% wrong for an hour. Weight by volume, or use a composite index.
- Treat a single-venue print as a data point, not a market event. The tell was available in seconds: Coinbase, Bitstamp and the perpetual market never moved. Cross-check before you act on a headline.
- Thin-book risk is stop-loss risk. A stale quote plus an automated stop trigger produces a real fill at a real price. On a pair with a 0.4% range on the dollar side and an 11.5 basis point spread on the CAD side, your exit is not guaranteed to resemble the Bitcoin price on the chart you are staring at.
And one thing to take from what Kraken did right: it stood behind the executed trades and it published the numbers. Kraken’s public OHLC feed is where every figure in this piece comes from, and the Bank of Canada’s FX reference series is where the parity math comes from. When an exchange’s tape contradicts the market, the tape is the evidence. Go read it.
How to Check the Bitcoin Price Yourself in Five Minutes
None of this needs a terminal you do not have. Pull the CAD and USD candles from the same exchange for the same window, convert one side with the central bank’s reference rate, and compare. If the gap between them is wider than a few tenths of a percent, you are looking at a broken book, not a moved market.
Then pull a second venue and a perpetual contract. If the dollar books are flat while one pair is off by double digits, the Bitcoin price on that pair is noise and the rest of the market is telling you the real one. Finally, check the volume behind the print: a genuine reprice arrives with size, and this one arrived with roughly 22 times a normal day’s volume on the affected pair.
None of that requires trusting a headline, and none of it requires trusting a broker’s chart feed either. It requires reading the tape the way a market maker does — which is the only way to tell a real Bitcoin price from a print.
The Bottom Line
The story that ran on Sunday was “Bitcoin briefly drops to $17K.” The accurate version is narrower and more useful: one fiat pair on one exchange mispriced against the FX rate for about twelve hours, bottoming at a 71% discount in the worst liquidity window of the week, while the Bitcoin price itself traded a 0.4% range on the same venue and never left the $55,100–$61,000 band all weekend.
The $17,000 was not a crash in Bitcoin. It was a crash in the plumbing that connects one thin order book to the currency it is denominated in. That is a smaller story than the headline, and a more instructive one, because the same plumbing sits underneath every quote you will ever look at — and underneath every Bitcoin price your screen will ever show you.