Read the headlines and it looks like Bitcoin is winning: dominance is 57.5%, the orange coin is catching a bid, and the rest of crypto is bleeding out. That reading does not survive contact with the numbers. On the actual figures, it is close to backwards.
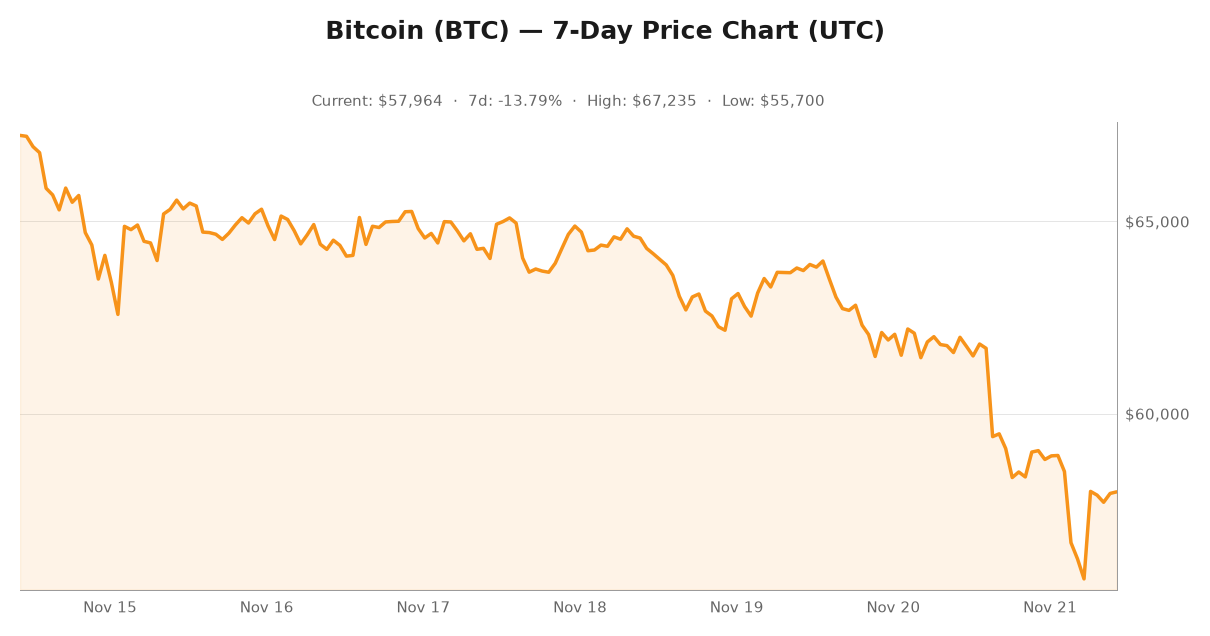
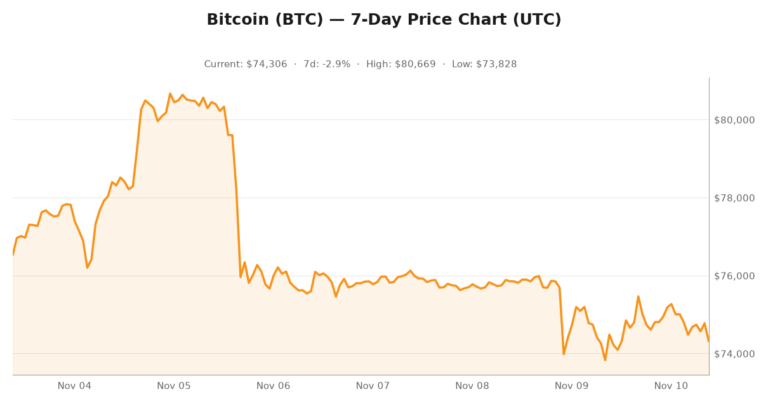
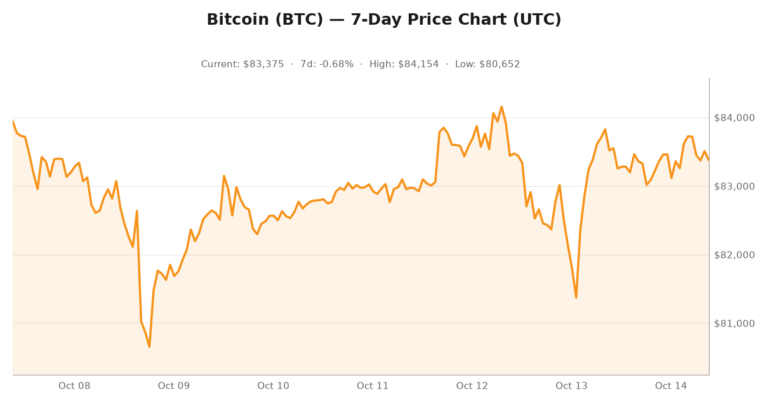
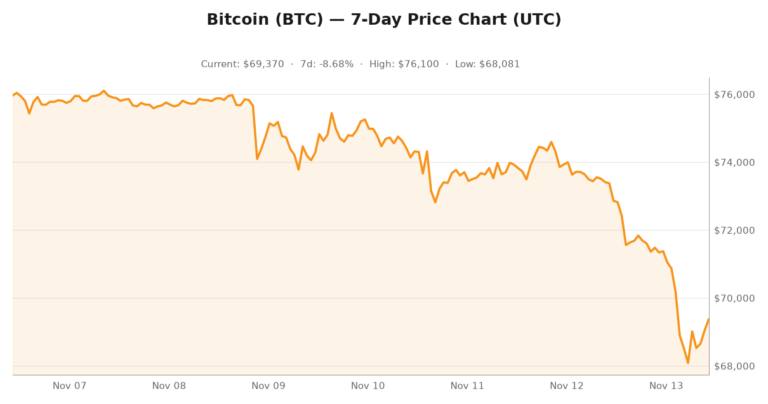
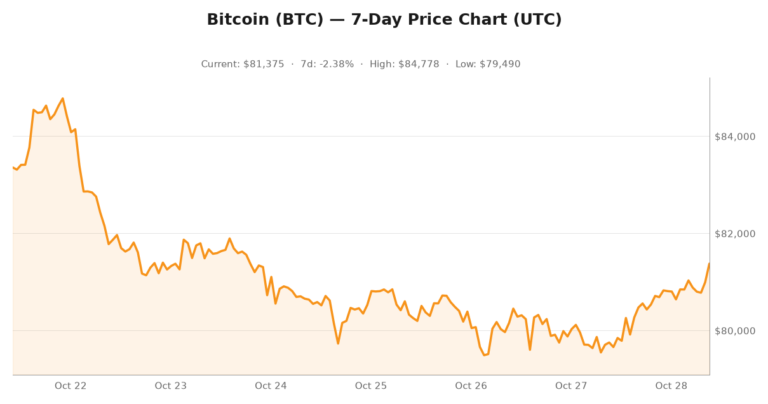
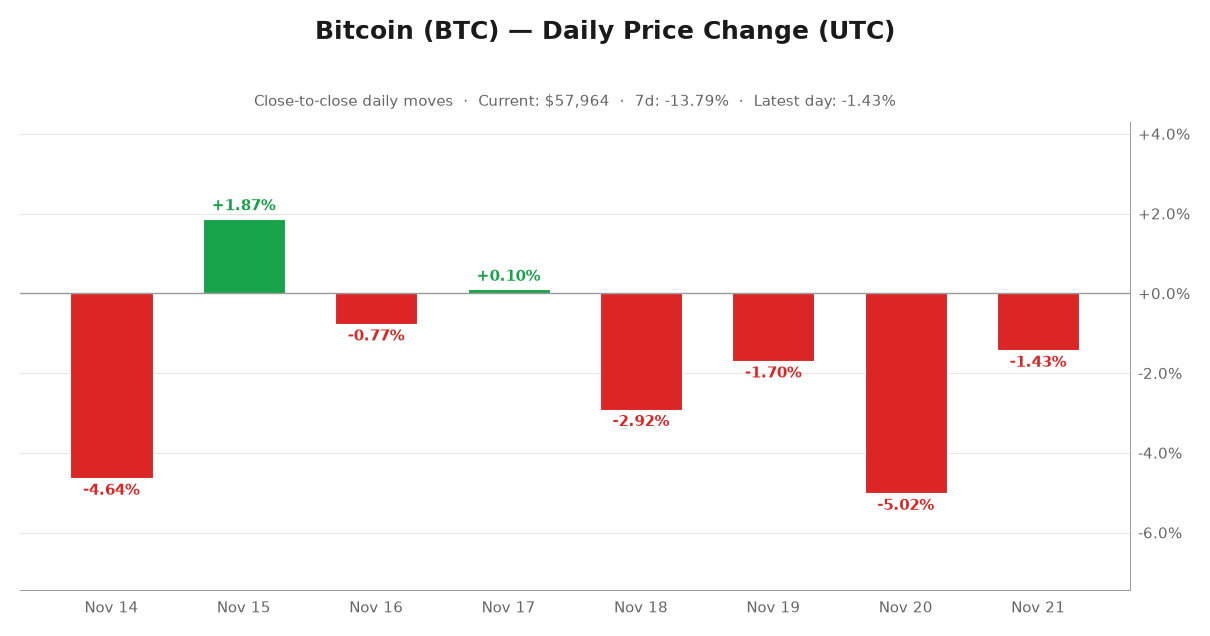
Start with the tape on Saturday, November 21, 2026. Bitcoin is near $57,909, off 6.1% on the day, off 13.4% on the week and off 29.1% over the past 30 days, which puts it roughly 32% below its September peak near $86,600. Ethereum trades at $1,636, down about 32% over the same month. Total crypto market cap is $2.02 trillion, down 7.75% in the last 24 hours alone, on roughly $147 billion of 24-hour volume. Bitcoin’s own market cap is $1.17 trillion.
So the real question is not whether Bitcoin is winning. It is whether its share is climbing because fresh money is moving into BTC, or because the rest of the market is leaving crypto altogether. The data points to the second, and that is a much less bullish story.
What Bitcoin dominance actually measures
Dominance is a ratio, not a flow. It is the market cap of the largest asset measured against the combined market cap of every crypto asset in the tracker. When the denominator collapses, the ratio rises even while the numerator falls just as fast. Calling that “Bitcoin winning” mistakes a scoreboard for a business result.
The full market-share leaderboard, as CoinGecko’s global tracker has it right now:
- Bitcoin — 57.52% of total crypto market cap
- Ethereum — 9.87%
- Tether (USDT) — 8.62%
- BNB — 3.41%
- USDC — 3.37%
- XRP — 2.80%
- Solana — 1.99%
- TRON — 1.42%
- FIGR_HELOC, a tokenized home-equity private-credit token — 1.38%
Look at that list twice. The second-largest name on it is a dollar token, and so is the third. Ethereum, the chain meant to eat its lunch through applications and settlement, is a rounding error next to $243 billion of Tether and USDC. And across the entire top ten, the only non-stablecoin that is neither a meme coin nor a legacy chain is a tokenized mortgage.
21,328 cryptocurrencies carry a live market today, and the largest asset is 57.5% of them. That is not a monopoly anybody built over years. It is what is left after everything else got repriced.
The pie shrank 26% in a month
Take the market-cap data for the 250 largest crypto assets and run the trailing 30-day math on it. Aggregate market cap falls from roughly $2.79 trillion to roughly $2.06 trillion, a 26.2% decline in one month. Over just the last seven days, that same basket is down 11.3%.
CoinGecko’s global tracker frames the same picture from a slightly different cut of the market: $2.02 trillion total, down 7.75% over the past 24 hours. The two totals sit about 2% apart because the global figure follows a narrower set of assets. The direction is identical either way.
This is not a rotation cycle. In a rotation, capital moves from one crypto asset into another and the total market cap stays roughly flat. Here the total is being destroyed at about a quarter per month, with 24-hour volume sitting at $147 billion and shrinking alongside price. That is the signature of capital leaving the asset class, not of capital reshuffling inside it.
Bitcoin’s Share Went the Wrong Way
Here is the part of the dominance story that is not making the rounds. On the same 250-asset basket, Bitcoin’s share of the market stood at 58.91% a month ago. Today it is 56.59%. Over the past week alone it slid from 57.96% to 56.58%.
That runs the opposite way from a dominance surge, and the reason is arithmetic: BTC fell 29.1% over the month while the basket fell 26.2%. By roughly three percentage points, Bitcoin underperformed the crypto complex on the way down.
Credit where it is due: Bitcoin did beat a large part of the field over 30 days. Ethereum -32.0%, Solana -34.4%, XRP -32.5%, Dogecoin -32.6%, Zcash -40.0%. But it gave ground to BNB (-28.2%), Monero (-28.3%), Hyperliquid (-24.9%) and TRON (-8.5%), the majors that fell least. A -29.1% print sits mid-pack rather than at the front. “Least bad” is not “winning,” and the dominance ratio hides that distinction completely.
Why the ratio still looks flattering
Two things prop up the leader’s share while the market contracts. First, the two dollar stablecoins, which together represent about 12% of the market and barely move in either direction. Second, the long tail of small-cap alts, which is shrinking far faster than the leaders. A ratio built from one frozen component and one collapsing component drifts upward no matter what the leader itself does.
Where the Money Actually Went
Tether’s market cap is $174.6 billion and USDC’s is $68.4 billion, so $243.0 billion between them, roughly 12% of the entire crypto market. Over the past 30 days Tether is down 0.05% and USDC is down 0.03%. Flat. Not down 26%. Not down 30%. Flat, while the assets sitting next to them lost a third of their value.
That flat stablecoin supply is the tell in this whole story. It means roughly no new dry powder came in, and roughly nothing drained back out into crypto risk. Capital did not rush into dollars. It left crypto risk assets entirely and parked in cash instruments, on-chain and off-chain alike.
Then there is the most telling line on the leaderboard. FIGR_HELOC, the tokenized home-equity and private-credit token, carries a $27.9 billion market cap, 1.38% of the market, and it is up 0.41% over the month. LEO is up 0.84%. Those two are the only sizeable names in the top ten that did not shed a quarter of their value in 30 days, and one of them is a tokenized mortgage rather than a crypto token.
If you want to know what the market is actually repricing, skip the dominance chart and read that line instead. The market is treating crypto-adjacent dollars and tokenized credit as cash-like assets, and treating everything else, the largest asset included, as beta. That is a change in what crypto is being used for, and it is a quieter story than a 57.5% dominance print suggests.
The chain itself is not the problem
Worth saying plainly, because the temptation is to blame Bitcoin’s rails for a price decline. They are not the problem. Network hash rate is running just over 1,100 exahashes per second, transaction fees are back to 1 satoshi per virtual byte, and roughly 20.1 million bitcoin are in circulation. The security budget is getting squeezed from the revenue side, and we covered that math in our warning about the 2028 halving, but that is a miner-economics problem, not why the market is repricing the asset.
One caveat deserves more attention than it is getting: three operators found the last 4,400-odd blocks. Foundry USA mined 25.4% of them, AntPool 19.8% and F2Pool 17.1%, which puts the top three at roughly 62% of blocks produced. Live numbers sit on mempool.space. That concentration is a genuine decentralization concern and it deserves its own post, but it has nothing to do with why the market cap just fell by a third.
Three numbers to watch into year-end
- Bitcoin’s market cap in dollars, not its share of it. That figure has to climb back above $1.64 trillion just to reclaim where it stood a month ago. Until then, a rising dominance ratio is a shrinking denominator flattering the numerator.
- Combined stablecoin supply, currently $243.0 billion. This is the real liquidity gauge for the whole space. A rising supply trend means dry powder is returning; a flat or falling one means more of the same contraction. Watch it on CoinGecko’s global charts.
- Total crypto market cap against the $2.79 trillion it held 30 days ago. Reclaiming $2.4 trillion with the leading asset above $65,000 would mark a genuine regime change. Staying under $2.1 trillion keeps the pie shrinking and keeps dominance math doing the talking for you.
Worth keeping an eye on as well: the ETF flow prints, which show whether real-world money is arriving to meet the selling. The daily numbers are tracked at Farside Investors, and CoinDesk’s markets desk tracks how price reacts to each one. Those flows are a better read on genuine demand than any ratio of market caps.
The bottom line
The 57.5% dominance print is being sold as proof that the leader is winning a fight. The numbers tell a quieter story. The crypto complex lost roughly 26% of its value in a month, and Bitcoin lost 29%. Its slice of the pie shrank by more than two points rather than expanding. The assets that held their value were dollar stablecoins and a tokenized mortgage.
None of that makes Bitcoin a bad asset. It makes the 57.5% headline a misleading one. Dominance is a ratio inside a contracting market, and the only way to know whether Bitcoin is accumulating real demand is to watch dollar-denominated market cap, stablecoin supply and ETF flows, not the share of a pie that keeps shrinking every week.
For a daily read on where prices actually closed, follow our Cointelegraph market coverage. This market moves fast enough that today’s numbers will be stale by morning.