Bitcoin’s $14 Billion Stablecoin Drop Is the Real Story
The market’s favorite explanations for a soft Bitcoin tape are always the same short list: ETFs aren’t pulling bids, Washington is circling, miners are capitulating, whales are asleep. All of those may be true this week. None of them are the number that actually matters.
Total stablecoin supply across every chain now sits at $292.36 billion, down from $306.62 billion on October 9. That is a $14.3 billion contraction in 30 days — a 4.65% shrink in the cash sitting on crypto rails, waiting to buy Bitcoin or anything else. Over six months the figure is down 7.23%. It is also below where it stood a year ago, at $302.49 billion on November 8, 2025.
Stablecoin supply is not a headline metric. It is the closest thing this market has to a broad money supply — the reservoir that every on-ramp and off-ramp ultimately drains from. When it contracts, the squeeze shows up everywhere at once, and it shows up first in the assets that depend on it most. Bitcoin is one of those assets.
The $14 billion nobody priced in
Here is the supply series, aggregated across every major chain by DefiLlama’s stablecoin dashboard:
- October 30, 2026: $299.70 billion
- November 1, 2026: $298.36 billion
- November 4, 2026: $295.13 billion
- November 6, 2026: $293.73 billion
- November 7, 2026: $292.31 billion
- November 8, 2026: $292.36 billion
That is a run of net redemption, day after day, interrupted only by a rounding-error uptick on Saturday. The 30-day change is -4.65%. The 90-day change is -2.30%. The 180-day change is -7.23%. The 365-day change is -3.35%. Every single window is negative.
Shrinking is not mysterious. Stablecoins exist to move fiat in and out of crypto, and they do it. When redemptions outpace new issuance, the float gets smaller. It gets smaller when investors rotate out of dollar tokens and into yield-bearing wrappers, when issuers quietly wind down marginal lines, and when offshore demand for dollars cools. None of that requires a crash to trigger. It just requires the arbitrage between crypto and banking to stop favoring inflows.
For scale: total crypto market cap is roughly $2.54 trillion, and Bitcoin alone accounts for about $1.53 trillion of it, per CoinGecko. So the stablecoin float is only around 11% of total market cap. That sounds small until you remember this float is the fastest-moving, most leveraged slice of it. Stables are the margin. When margin shrinks, spot prices wobble.
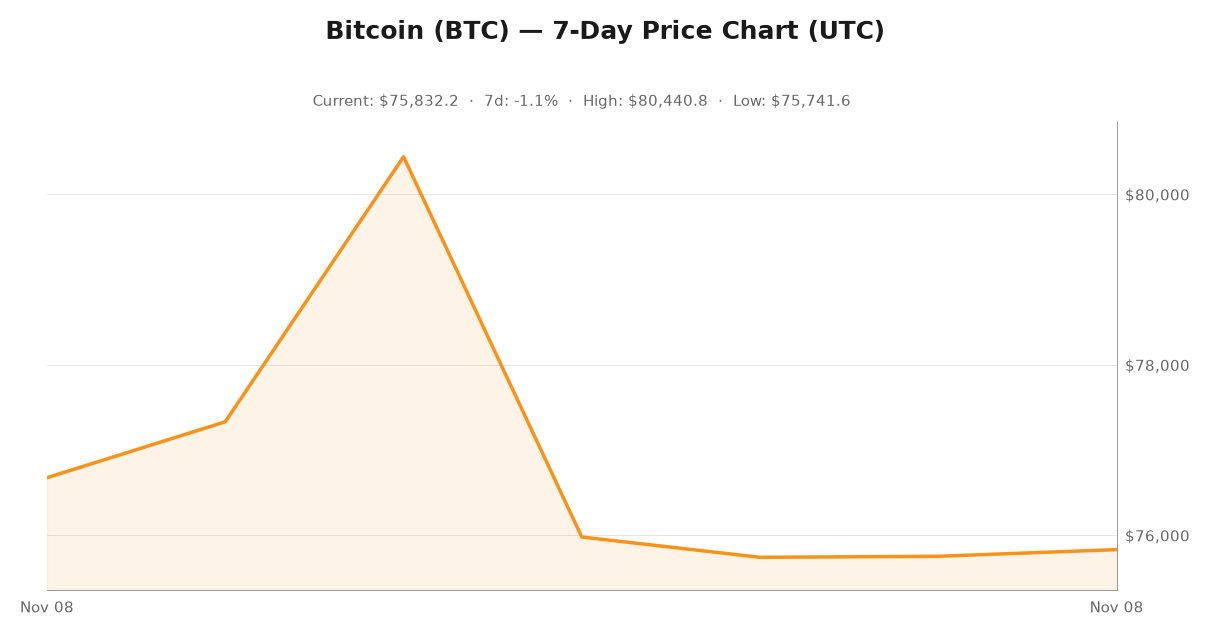
Now the timing. Bitcoin peaked near $84,000 on October 21 and last traded around $75,800 on November 8 — a slide of roughly 9.7%. Almost none of the stablecoin damage had happened yet on October 21, when supply was still above $298 billion. The bleed has been steady since, and it has not stopped.
Where that liquidity lives — and why Bitcoin is not on the list
Here is the part that usually gets skipped: almost none of that $292 billion belongs to Bitcoin in the first place. It sits on other chains.
- Ethereum: $134.42 billion
- Tron: $93.60 billion
- Solana: $14.58 billion
- BNB Chain: $13.72 billion
- Hyperliquid L1: $6.65 billion
- Base: $5.01 billion
- Arbitrum: $3.56 billion
- Polygon: $2.94 billion
Ethereum and Tron alone account for roughly $228 billion — about 78% of every dollar of stablecoin liquidity in existence. Bitcoin does not appear on that list, and not because the number is small. Bitcoin simply does not have a native stablecoin rail. That is a hard structural fact, visible on DefiLlama’s chain breakdown.
Decentralized finance tells the same story. Total value locked on Ethereum runs about $43.39 billion. On Bitcoin, it is roughly $4.04 billion — a tenth of the size, and composed mostly of wrapped BTC and lending markets rather than stablecoin settlement. Solana holds about $5.21 billion and Base $5.87 billion, both still dwarfing Bitcoin’s number.
None of this makes Ethereum the better asset. It makes it the better venue. The vault-versus-checkout-counter frame is the useful one here: scarce, expensive-to-move, slow-to-spend assets work fine when they are the destination. They strain when they have to compete for capital with the checkout counter, because that is where the stablecoins already are and moving them between venues costs basis points.
This is the asymmetry worth sitting with. Stablecoins are Bitcoin’s competitors for liquidity more than they are its customers. Every dollar that mints onto Tron or Ethereum arrives on-chain with somewhere else to go. Bitcoin, by contrast, has to compete for capital that already lives on other chains — and the cheapest path to grabbing it usually runs through a stablecoin first. For Bitcoin, stablecoins are less a liquidity source and more a tollbooth the market must pass through on its way somewhere else.
The Bitcoin network is telling the same story
Stablecoin data is the macro read. The Bitcoin chain’s own metrics are the micro check, and they agree.
- Daily transactions: roughly 591,830 on the latest reading, against a 30-day average near 675,409
- Recommended fees: 3 sat/vB for fastest confirmation, 1 sat/vB for an hour
- Pending mempool: about 61,700 transactions and 14.7 megavirtual bytes
You can watch all of it live on mempool.space. A one-satoshi-per-virtual-byte environment is a symptom of a very specific market: plenty of available block space, not enough bidding for it. That is not automatically bearish. Cheap settlement is genuinely good for people building on Bitcoin, and for anyone transacting who wants to pay less. But paired with a shrinking stablecoin float, it tells you the marginal dollar is not in a hurry.
Compare that with the November 4 and 5 flush. The late-October slide pushed daily volume on Kraken to roughly 4,500 and 5,100 BTC, well above the recent baseline. Heavy volume on a down move reads as capitulation or distribution. Light volume on a drift lower, with fees pinned to the floor, is something else entirely: an absence of conviction in either direction, because the fuel has been pulled out of the system.
Five numbers worth watching next
If you want a working early-warning system for this kind of liquidity drain, stop watching ETF flow ticks and watch these instead:
- Net stablecoin issuance, not circulating-supply headlines. USDT runs about $176.8 billion and USDC about $70.6 billion right now. Watch whether the combined number grows or shrinks week over week. A clean reclaim of $300 billion is the clearest bullish signal available to anyone watching crypto.
- Tron’s net issuance specifically. Tron holds $93.6 billion and is where the fastest retail money moves. Tron issuance trends lead the aggregate series more often than they follow it.
- Exchange balances versus DeFi balances. Stablecoin supply moving from exchange wallets into lending and trading protocols is a bullish rotation. Supply moving the other direction, onto exchanges and sitting still, is distribution.
- Transaction count and fees together, never separately. Either metric alone is noise. Rising transactions with rising fees means real demand for blockspace. Falling transactions with sub-2-satoshi fees means the bid has left.
- Bitcoin-native stablecoin rails. If a credible Bitcoin-native stable settles meaningful volume, the asymmetry described above starts to break. That is the genuine bull case for a Bitcoin liquidity thesis — not another ETF wrapper around the same dollars.
The bottom line
Bitcoin has spent the last month being explained. It has been blamed on ETFs, on senators, on miners, on geopolitics. The quieter explanation is that the cash behind the whole system shrank by $14.3 billion in 30 days, and Bitcoin is the asset with the least direct claim on it.
None of this makes Bitcoin a bad trade. A $14 billion contraction in liquidity with the price down less than 10% is a market that has absorbed a great deal of redemption without breaking. That is a kind of resilience, and it deserves credit.
It is also a warning about what Bitcoin is being asked to do. If the stablecoin float keeps contracting, Bitcoin does not need a bad story to struggle. It just needs the bid to stay thin. So if you are positioning around Bitcoin into the back half of November, the data that matters this week is not in the ETF flow print or the legislative calendar. It is in the stablecoin supply curve, and the curve is still pointing down.
Watch Tether issuance and USDC balances. Until that number turns, every rally is a rally inside a shrinking pool.