Bitcoin Owns the Savings. Stablecoins Own the Settlement.
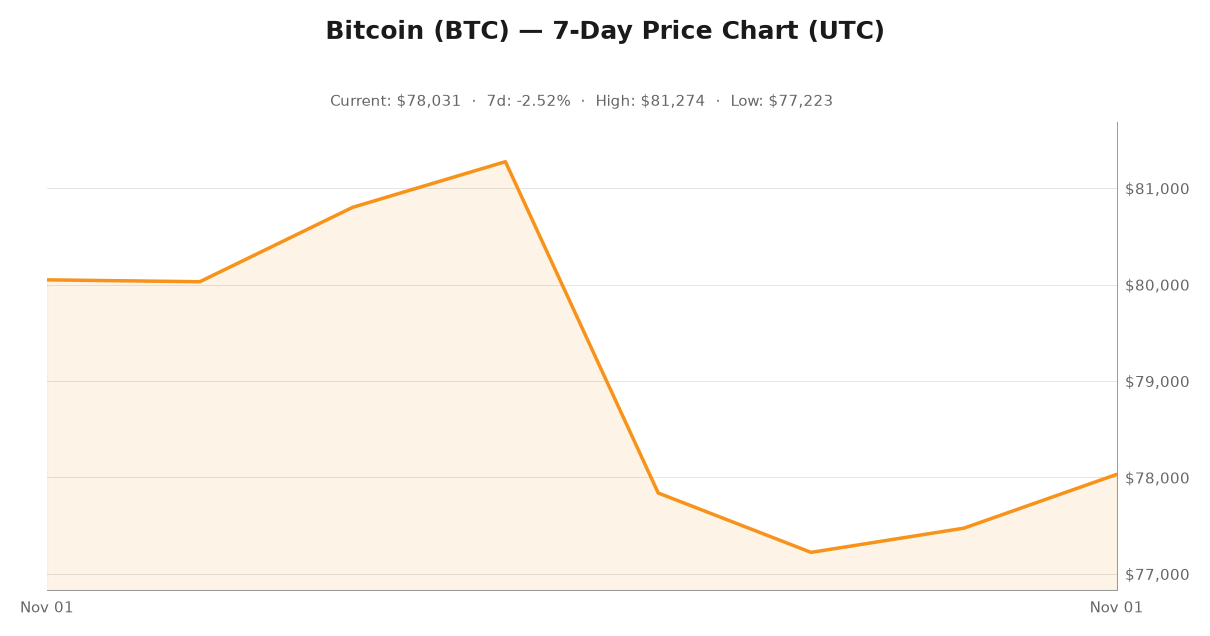
Bitcoin is the undisputed heavyweight of crypto by market value, and nearly everything written about the asset in 2026 confirms it. At roughly $78,034 on November 1, 2026, the market capitalization sits near $1.57 trillion against a total crypto market of about $2.61 trillion — a dominance share of just under 60%, according to CoinGecko. That is the story most coverage repeats.
It is also the least interesting number in crypto. Market capitalization measures what holders believe an asset is worth. It does not measure how much money actually moves, who moves it, or on which rails it settles. Those questions have a different answer, and the answer increasingly belongs to stablecoins.
The clearest way to see the split is this: the largest crypto asset holds about 60% of total market cap, while dollar-pegged stablecoins now carry roughly $299 billion in outstanding supply — nearly a fifth of the same market value — and turned over about $33 billion of spot volume on November 1, according to the supply trackers at DefiLlama and CoinGecko. A float that size, sitting next to that much daily flow, is not a rounding error. It is a parallel settlement system running on other people’s chains.
Three Numbers, Three Different Questions
Before drawing conclusions, it pays to separate the metrics, because crypto commentary routinely blends them.
- Market capitalization (a stock): what the market believes an asset is worth. The largest crypto asset: about $1.57T. All dollar-pegged stablecoins combined: about $299B.
- Circulating supply (a float): dollars actually outstanding and claimable on-chain. The stablecoin float has climbed past $298 billion and keeps grinding higher, per DefiLlama’s stablecoin tracker.
- Transfer volume (a flow): value actually changing hands. This is where the two sides are not even in the same conversation.
The base layer’s own numbers
Bitcoin’s settlement layer looks like this: roughly 719,000 transactions per day on average over the trailing 30 days, moving an estimated $7.65 billion of value daily, per the on-chain series published by Blockchain.com. That works out to roughly $230 billion of value movement per month against a $1.57 trillion asset — a turnover rate near 0.4% per month.
Stablecoins, by the most conservative public measure, turn over more in a day than the base layer moves in a week. The comparison is imperfect: exchange-reported spot volume counts trades that frequently settle off-chain, and it double-counts round trips through centralized venues. But even after discounting for those distortions, the gap is not marginal. It is an order of magnitude.
Where the Stablecoin Float Actually Sits
The second data point is more interesting than the first: none of it is on the Bitcoin network.
- Ethereum — about $140.2B, or 47.5% of stablecoin supply
- Tron — about $93.8B, or 31.8%
- Solana — about $15.2B, or 5.1%
- BSC — about $13.1B, or 4.4%
- Hyperliquid L1 — about $6.7B, or 2.3%
- Base — about $5.1B, or 1.7%
- Arbitrum — about $3.6B, or 1.2%
- Polygon — about $2.9B, or 1.0%
The flagship asset does not appear on that list. Not small, not rounding error — absent. The chains that won the stablecoin float are the ones with cheap, fast, smart-contract execution: places where a token can be issued, redeemed, and routed programmatically. The Bitcoin base layer is deliberately bad at that, and no amount of market-cap dominance changes a design constraint.
There is a third rail that never touches a public chain at all: off-chain exchange settlement. Much of the movement in dollar tokens happens between venues, where the token changes hands and the underlying blockchain barely notices. Reporting from CoinDesk on issuer attestations and exchange wallets makes clear how much of that flow is invisible to on-chain observers entirely.
The Security Budget Squeeze Makes This Worse, Not Better
Here is where the network’s own data complicates the comfortable story. The one-month average hash rate is running near 1,087 EH/s in early November, and the next difficulty retarget at block height 975,744 is estimated to land near +0.23% — a modest increase for a chain this size.
Yet recommended fees at mempool.space have been printing 1 to 3 satoshis per virtual byte for the cheapest confirmations. Miners are committing more compute than ever to block space the market is not paying for. The network is securing more value per block than at any point in its history while collecting a shrinking share of the fees required to do it.
Why fees matter for the settlement thesis
That combination has a name in the industry: the security budget problem. And it connects straight back to the settlement question. If the chain is not where money moves, then its transaction fees cannot be the mechanism funding its own security. The chain has to be subsidized from elsewhere — from issuance, which is designed to shrink by design, and from the asset’s scarcity premium, which is ultimately a bet on monetary debasement rather than on payments.
None of this means the network is failing. It means the asset is not doing what the payments narrative has been claiming for it. It is doing something else, and the data is unambiguous about which.
So Is the Asset Winning or Losing?
Both, depending on which war you measure. It is winning the savings war and losing the settlement war — and for money, that pattern is normal rather than anomalous.
The dollar dominates global payments while the euro and yen handle a smaller share of cross-border settlement. Gold dominates store-of-value psychology while circulating fiat does the actual flow. BTC’s role inside crypto is behaving like the hard reserve asset: the unit of account that institutions accumulate, that ETFs wrap, and that corporate treasuries hold. The tokenized dollar does the payments work.
Price discovery has left the chain
The flow numbers prove the pattern. The 30-day average transaction count of about 719,000 is up only around 2% from roughly 704,000 in the prior 30-day window — and that is in a week when the asset itself traded between roughly $77,200 and $81,300. Price discovery is happening through ETFs, treasury buyers, and derivatives. On-chain transfers are not the marginal buyer.
Three Ways the Balance Could Shift
- Stablecoins mint their way onto Bitcoin-linked rails. If issuers begin issuing dollar tokens against BTC-collateralized wrappers on Bitcoin layer-2 networks, the settlement float would start touching bitcoin-denominated value. Note the caveat: it would still not need the consensus layer to function, but it would change where the float sits.
- Reserve-backed stablecoin rules push issuance into regulated hands. Tighter reserve and redemption requirements around dollar tokens tend to favor issuers with balance-sheet depth and existing banking plumbing. Those issuers overwhelmingly settle on Ethereum, Tron, and other smart-contract chains.
- Bitcoin’s own rails get materially cheaper and simpler. Continued Lightning capacity growth, cheaper second-layer fee markets, and better wallet UX could push routine peer-to-peer activity off the base layer. That would help the payments case — and would also further reduce base-layer fee revenue, which is exactly the security budget problem above.
What to Watch Every Week
- Share of stablecoin supply by chain. If any meaningful share migrates toward Bitcoin-linked networks, the settlement picture changes. So far, none has.
- Bitcoin’s 30-day average transaction count. The cleanest available measure of settlement demand, and the number that most directly contradicts the payments narrative.
- Recommended fees alongside hash rate. If fees stay pinned at 1–3 sat/vB while hash rate grinds higher, the security budget squeeze is worsening.
- Stablecoin float growth versus bitcoin market-cap growth. If the float compounds faster than the market cap, the settlement crown widens further.
- DEX volume. Roughly $249 billion over the trailing 30 days, or about $7.0 billion per day. The on-chain economy is expanding on chains that Bitcoin does not settle.
Conclusion: A Reserve, Not a Rail
The near-60% dominance and $1.57 trillion market cap are real, and they reflect genuine demand for a scarce, non-sovereign reserve asset. But the money-moving layer of crypto has migrated. Stablecoins now carry roughly $299 billion of supply, turn over tens of billions of dollars daily, and sit almost entirely on Ethereum, Tron, Solana, and layer-2 networks — while the base layer moves about $7.65 billion a day across roughly 719,000 transactions, at 1–3 sat/vB fees, with a security budget that must increasingly be funded by issuance.
That is not a bear case for bitcoin. It is an accurate description of what bitcoin has become: the reserve asset of crypto, not the payment network. If you are underwriting it, stop underwriting it as a payments rail and start underwriting it as a savings and collateral primitive. If you want to know where crypto actually settles, the answer has not changed all year, and it is not bitcoin.
Before you act on any of this, pull the live figures yourself: the global crypto market dashboard for dominance and market cap, the stablecoin supply breakdown at DefiLlama, and Bitcoin’s own transaction series for the settlement side of the ledger.