Bitcoin Options Are Cheap After a 4-Week Low in Price
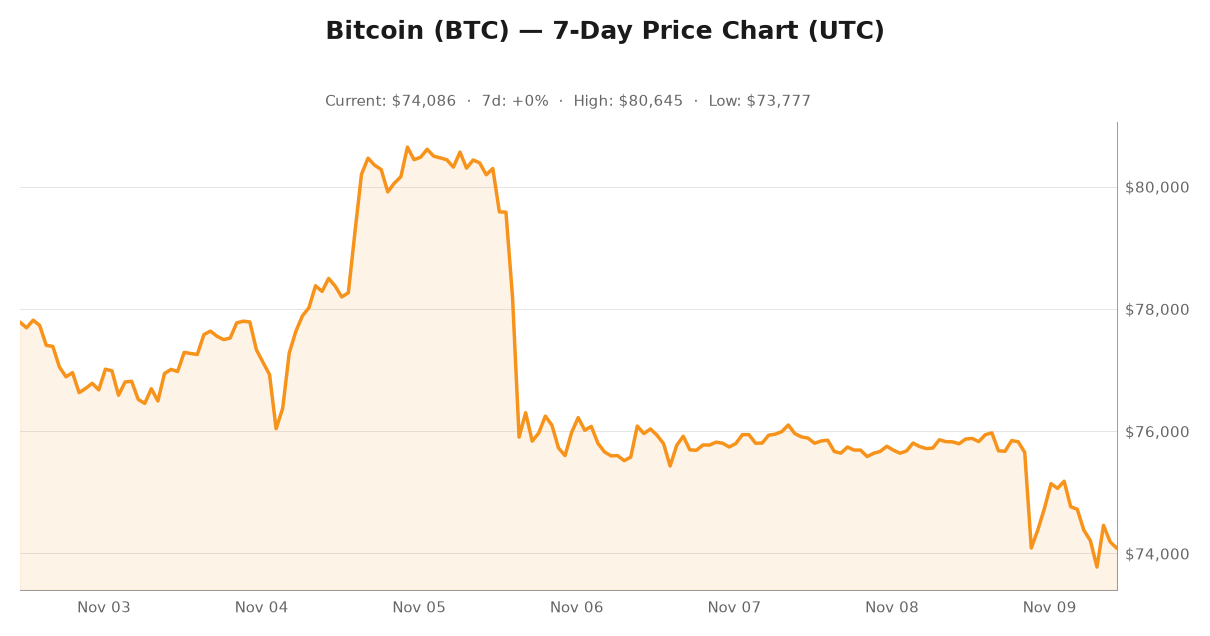
Bitcoin is trading around $74,200 as of Monday, November 9, 2026, roughly 13% below its 30-day high and scraping a four-week low after a week that included more than a billion dollars in liquidations. Here is what most market commentary is missing: Bitcoin options are not pricing any of it.
Deribit’s DVOL index — a single-number read on Bitcoin options implied volatility — closed at 41.1 on Monday. That sits at the 48th percentile of the past year. The one-year median is 41.8, the one-year low is 33.6, and the one-year high is 82.6. For context, when Bitcoin options were genuinely stressed last year, DVOL traded well above 80. A market printing four-week lows and liquidating a billion dollars in leveraged positions is supposedly being valued at the median volatility of the last twelve months.
That gap is the story, and it is worth understanding what Bitcoin options are actually telling you right now.
Price Action: A Four-Week Low, Not a Breakdown
The path matters. Bitcoin closed at $80,441 on November 4, then dropped roughly 5.5% in a single session on November 5 to $75,980, chopped sideways for three days, and broke to a four-week intraday low of $73,444 on November 8. It closed at $74,738 on the 8th and was trading near $74,211 on Monday morning, with the day’s range running from $73,602 to $75,500.
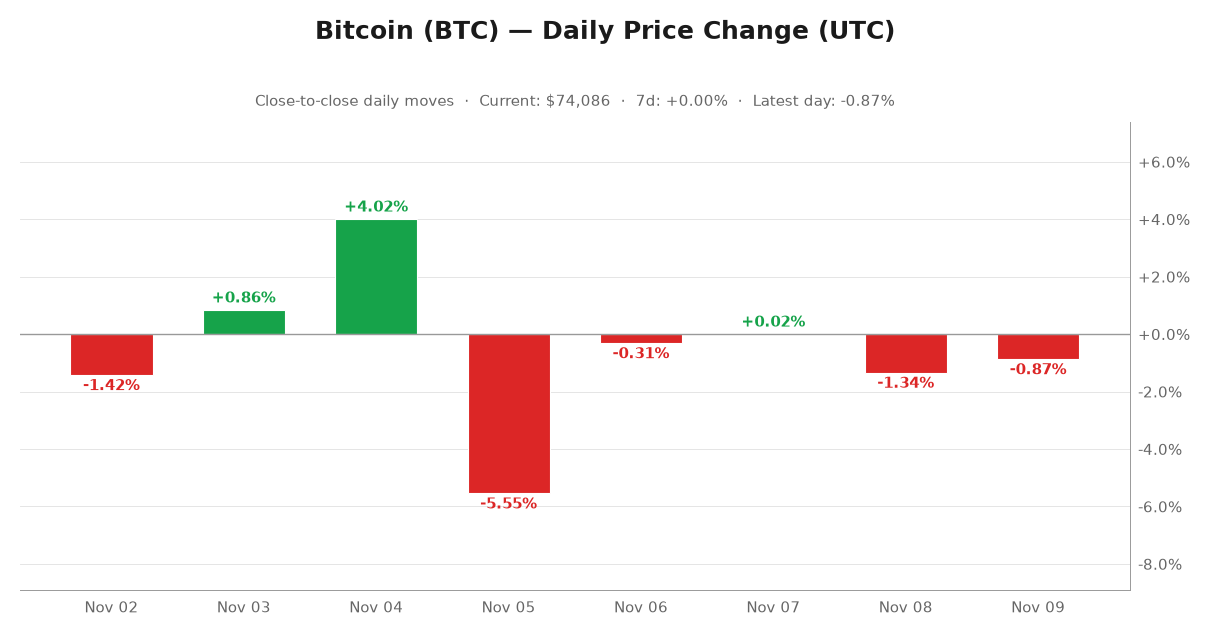
That is a 7.7% slide in four sessions. Against the 30-day high of $84,840, the drawdown is closer to 13%. For the year, Bitcoin opened around $87,500 and is down about 15%.
None of this is a catastrophe. It is also not a market that has settled — and Bitcoin options have barely noticed. The two-way volatility in Bitcoin this week was driven by headline risk — an Nvidia accounting scandal and stalled Iran talks produced a sharp drop and a sharp pop in the same session. More than a billion dollars in bullish bets were liquidated along the way, which tells you leveraged longs were not prepared for the move.
What Bitcoin Options Are Actually Pricing
Bitcoin options are an insurance market that also trades as a directional instrument. Every premium paid to a seller of volatility is a bet that the underlying will move less than the market expects. When that assumption fails, the insurance buyer wins and the seller pays up.
The cleanest way to see the current state of Bitcoin options is the term structure — implied volatility at each expiry, at-the-money. Pull it from the Bitcoin options board on Deribit and the curve reads like this:
- November 13 (4 days out): 42.3% implied
- November 20 (11 days): 39.3%
- November 27 (18 days): 38.5%
- December 25 (46 days): 38.9%
- January 29 (81 days): 39.1%
- March 26 (137 days): 40.0%
- June 25 (228 days): 40.7%
- September 24 (319 days): 41.1%
Two features stand out.
1. The front of the curve carries an event premium
42.3% at four days out versus 38.5% at 18 days is a 3.8-point front bump. Something specific is being hedged inside the next two weeks, and CoinDesk’s macro calendar for the week ahead points at US inflation data and a heavy corporate earnings slate as the candidates. That part of the curve is doing its job.
2. The belly of the curve assumes calm
Here is the part that should make you pause. The 18-day at-the-money print of 38.5% is barely above Bitcoin’s own 30-day realized volatility of 36.0%. A market that just lost 7.7% in four sessions is being insured at a price that assumes the next three weeks look like the last three weeks — not like a market printing four-week lows with a billion dollars of liquidations behind it.
The Vol Premium Is Thin, Not Fat
It is easy to misread 41% implied volatility as “expensive.” Compare Bitcoin options to what Bitcoin has actually been doing:
- 30-day realized volatility: 36.0%
- 60-day realized volatility: 37.3%
- 90-day realized volatility: 41.2%
- Current DVOL (implied): 41.1%
Implied volatility sits 5.1 points above the 30-day realized number, but essentially equal to the 90-day realized number. Realized volatility is backward-looking and it lags badly. It only reflects the November 5 flush because that flush is now inside the window. The forward-looking number that traders actually pay for has barely moved since before the drop: DVOL was 38.1 on November 4, the day Bitcoin closed at $80,441. It is 41.1 now. Three points of repricing for a 7.7% slide.
Live spot data is tracked on the CoinGecko Bitcoin page, and the longer-run price history is on Blockchain.com’s market price charts.
The Skew Tells You Where the Fear Actually Sits
Volatility level is only half the story for Bitcoin options. The other half is skew — how much extra people pay for downside protection relative to upside. Measure it properly, using exchange-computed deltas at the 25-delta point on each expiry, and the result is remarkably flat and remarkably complacent:
- November 13: 46.9% put vs 40.7% call — +6.2 points
- November 20: 43.3% vs 38.0% — +5.3
- November 27: 42.7% vs 37.4% — +5.3
- December 25: 41.8% vs 38.9% — +3.0
- January 29: 43.4% vs 38.3% — +5.1
- March 26: 45.7% vs 39.6% — +6.1
Every expiry carries a put premium. That is normal and healthy. What is not normal is how small the premium is: three to six volatility points for downside insurance in a market that has not made a new 30-day high since October and just printed a four-week low.
The flattest reading is also the most interesting. December 25 — the largest expiry on the board by a wide margin — prices downside at just 3.0 points above upside. If the market expected a meaningful breakdown before year-end, that is the expiry that would show it. It does not.
Open Interest Says Bullish. Trading Flow Says Otherwise.
Here is where the consensus read of Bitcoin options breaks down.
Total open interest across every expiry runs roughly 197,000 call contracts against 142,000 put contracts — a put/call open interest ratio of 0.72. That is the number most people quote, and it reads bullish: more calls than puts sitting on the book. It is also the most misleading number in Bitcoin options right now.
But open interest is a stock, not a flow. It accumulates stale positions and says nothing about who is paying up this morning. Look at traded volume instead: roughly $12.3 million of calls against $26.0 million of puts, a put/call volume ratio of 2.11. Traders are buying puts at more than twice the rate they are buying calls.
And the taker data is where it gets sharper. Over a three-and-a-half-hour window of Bitcoin options trading on November 9, roughly $385 million of notional changed hands. Net, takers sold $8.9 million of calls and sold $18.5 million of puts. Both sides net sold. That is premium collection — Bitcoin options traders are short volatility almost everywhere.
Short volatility into a market that has already delivered a 7.7% four-session drawdown is a trade with a specific risk profile. It works brilliantly while realized stays below implied. It works terribly the moment realized catches up.
The $37 Million Put Nobody Is Talking About
Inside that net-selling tape there are exactly two large exceptions, and they point in opposite directions.
- December 25 calls: +$53.0 million of net taker buying. Somebody paid up for December upside. Call open interest in the December expiry is 83,341 contracts against 57,933 puts — the largest concentration anywhere on the board, with the 80,000 strike alone holding 7,960 contracts.
- November 20 $72,000 puts: +$37.0 million of net taker buying in a single strike. Not spread across the chain. One strike, one expiry, one session. Takers bought roughly $37.0 million of November 20 $72,000 puts while selling only about $7,000 of that same strike. The neighbouring 72,000 call was net sold $354,000, so this is not a call-put spread dressed up as a put purchase.
That November 20 put strike sits about 3.6% below spot. It is the single largest directional bet in the Bitcoin options market right now, it is on the downside, and it expires in eleven days.
The 70,000 Put Wall and the Miner Floor
Concentrate Bitcoin options open interest by strike and a wall shows up immediately:
- $70,000 puts: 10,742 contracts of open interest, $6.87 million traded
- $72,000 puts: 8,164 contracts, $7.17 million traded
- $60,000 puts: 12,076 contracts
- $80,000 calls: 12,858 contracts — the largest single strike on the board
- $90,000 calls: 11,985 contracts
- $100,000 calls: 11,938 contracts
The put wall between 70,000 and 72,000 is where the largest volumes in the entire chain were traded this week. It is also, oddly, where a real-world price floor keeps surfacing: CoinDesk reported that some Finnish data centers heat homes with bitcoin miners’ excess heat on the condition that Bitcoin stays above $70,000. That is an economic fact rather than a chart pattern, and it puts the same round number on the map for a reason.
Concentrated open interest at a strike cuts both ways. It can act as a magnet as dealers hedge into it, and it can act as a speed bump as that hedging works against the crowd. On the current evidence it is also the level the one serious directional bet in the market is aimed at.
What Would Break This Read
Every data-driven view needs a falsification test. Here are four:
- DVOL breaks above 48-50 and holds there while spot is flat or lower. That would mean Bitcoin options have finally repriced the drawdown, and every premium seller in the chain is short.
- The 25-delta risk reversal at December compresses below +2 points from +3.0. Downside insurance getting cheaper while price falls is capitulation on the put side.
- The Bitcoin options put/call open interest ratio flips above 1.0 from 0.72. That would be the first meaningful change in positioning since the flush.
- Spot closes below $73,444, the November 8 four-week low, and the November 20 $72,000 put does not move at all. If the market has real fear of a breakdown, that is the contract that should be screaming.
Conversely, if Bitcoin reclaims $80,400 — the November 4 close — with DVOL still near 41, then the options market was right and the bears were early. Watch the 80,000 call strike: 12,858 contracts of open interest is a lot of premium that has to keep paying to work.
The Bottom Line
Bitcoin options are cheap in a way that only makes sense if the recent drawdown is over. Implied volatility at the 48th percentile of the past year, an 18-day at-the-money print of 38.5% barely above 30-day realized volatility, and a skew that prices a three-point downside premium in December — none of that describes a market pricing another 13% of downside.
So the risk is not that Bitcoin options are mispriced on the upside. It is that they are mispriced on the downside, that the crowd is net short volatility, and that one desk paid $37 million for November 20 $72,000 puts in the middle of it. That is the trade Bitcoin options are offering.
The market is not hedging. It is selling insurance. That is a perfectly good trade right up until it is not, and a four-week low is the first hint that this market has stopped paying for calm.