Bitcoin Options Look Calm. The Data Says Otherwise.
Something strange is happening in the Bitcoin derivatives market, and almost nobody is talking about it. Front-month implied volatility on the largest listed Bitcoin options expiries has fallen to roughly 21%, the level you normally see right before a market goes completely quiet. And yet the Bitcoin options book itself is tilted hard toward calls, open interest is clustered into two expiries worth more than $21 billion, and the realized volatility of the underlying asset has been quietly climbing all week.
Those three facts do not fit together neatly. They fit together perfectly if you understand what Bitcoin options pricing actually measures, and what it is failing to measure right now.
What the Bitcoin Options Market Is Pricing Today
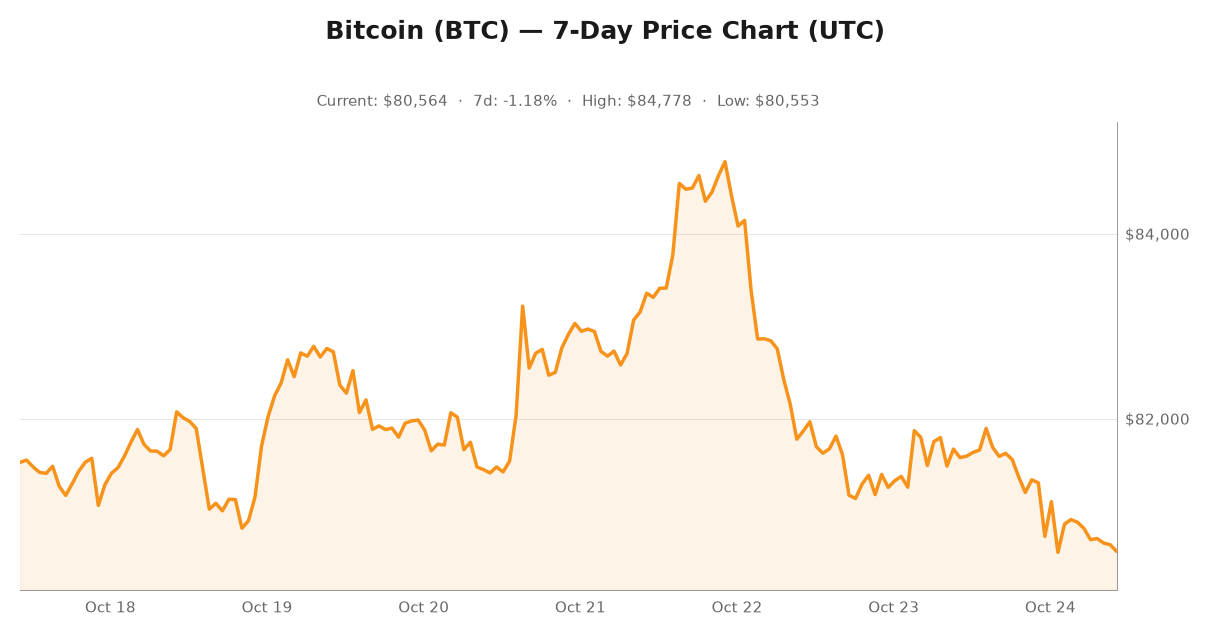
As of October 24, 2026, Bitcoin trades near $80,560, down roughly 1.3% on the day and about 4.5% over the past 30 days from a $86,490 high. Market capitalization sits near $1.62 trillion and dominance holds around 60%. Total crypto market capitalization is about $2.69 trillion after a 4.3% daily drop, and 24-hour spot turnover of $62 billion works out to only 2.3% of total market cap. That is thin liquidity for a market this size.
Now the Bitcoin options side. Across listed venues, roughly 385,000 Bitcoin options contracts are open, worth about $31 billion in notional exposure. The put/call ratio on open interest sits at 0.595, meaning roughly ten calls for every six puts. Volume flows are less lopsided at 0.804, which tells you the call-heavy positioning is being built, not churned. Open interest data across major Bitcoin options venues is aggregated and published by platforms like Deribit, while live price and market cap figures come from trackers such as CoinGecko.
Here is the number that should make you pause. At-the-money implied volatility, the market price for a one-standard-deviation move, reads 20.7% for the October 25 expiry, 23.8% for October 26, 26.8% for October 27 and 31.0% for October 30. Further out the curve climbs to 36.7% for November 6, 37.4% for December 25, 38.3% for March 2027 and 39.6% for September 2027.
That curve is a textbook steep contango, and on the surface it looks healthy: cheap short-dated protection, expensive long-dated hedging, no panic anywhere in the book.
The Volatility Mismatch Nobody Wants to Talk About
Here is the problem. Implied volatility is a price, not a forecast. So compare it to what Bitcoin has actually done.
- 30-day realized volatility: 25.0%
- 14-day realized volatility: 28.2%
- 7-day realized volatility: 30.8%
Short-dated implied volatility of 20.7% to 31% is trading below the 25% the asset has already realized over the past month, and well below the 30.8% it realized over the past week. The market is charging less for Bitcoin options insurance than the underlying has been costing to hold.
That is not a calm market. That is an underpriced one. Volatility tends to mean-revert from lows, and when the realized tape keeps outrunning what the Bitcoin options market charges, the repricing tends to be violent rather than graceful.
Why the Curve Is Contangoing in the Wrong Direction
Long-dated Bitcoin options at 38% to 40% implied volatility tells you something specific. The market is not hedging a crash. It is hedging a regime change. Somebody is paying a nearly 40% annualized premium on a September 2027 exposure for optionality that is about something structural: the next halving supply economics, a custody or regulatory shift, an ETF structural change, a monetary policy regime break. Not about the next two weeks.
Meanwhile the front end is priced as if nothing can happen before month end. That term structure says the market is confident about the short run and uncertain about the long run. It is a bet, and it has a specific failure mode. The front end is where Bitcoin options gamma actually does damage, and it is the cheapest part of the curve to reprice.
Why the Call-Heavy Book Is Not the Bullish Signal It Looks Like
A put/call ratio of 0.595 on open interest is routinely sold as evidence of bullish conviction. Read the expiry concentration before you do that.
- October 30 expiry: about 137,000 contracts, roughly $11.0 billion notional, max pain at $78,000
- December 25 expiry: about 132,000 contracts, roughly $10.7 billion notional, max pain at $75,000
- November 27 expiry: about 35,700 contracts, $2.9 billion notional, max pain at $81,000
- March 26, 2027 expiry: about 42,800 contracts, $3.4 billion notional, max pain at $76,000
Those two mega-expiries account for roughly 70% of the entire listed Bitcoin options open interest book. Concentration like that is not conviction. It is calendar mechanics. Institutional structured products, dealer hedges and systematic income strategies all cluster around month-end, quarter-end and expiry dates because that is when their own risk limits reset.
Now look at where max pain sits relative to spot at $80,560. The two biggest expiries carry max pain strikes of $78,000 and $75,000, between roughly 3% and 7% below the current price. The November expiry, with far less open interest, has max pain at $81,000, essentially at spot.
Dealer hedging around concentrated expiry exposure does two things. It can pin price toward max pain into expiry, and it can accelerate a move once the strike breaks. Either way, the flow that dominates Bitcoin options positioning over the next week is mechanical. It is not a vote on direction.
Read the Volume Ratio Too
The volume put/call ratio of 0.804 tells a different story from the 0.595 open interest ratio. Traders are buying calls at close to the rate they are buying puts, but the stock of open interest is heavily call-loaded. That usually means call buying has been concentrated into fewer, larger positions rather than reflecting a broad retail rush. Broad retail call buying tends to show up in volume too. It does not show up here.
The Contrarian Read: Cheap Front-End Vol Is the Actual Risk
Most commentary on this tape will focus on ETF flows, on the $78,000 support zone, or on the calendar shape of Bitcoin options expiries. The contrarian point is simpler and more actionable: the volatility being offered for the next week is priced below what the asset has been delivering, and the week’s most crowded trade is directional call buying that will not survive a volatility regime shift.
Three things to watch before month end
- Does realized volatility keep climbing? If 7-day realized holds above 30% while October 30 implied stays near 31%, the front end is still cheap and the repricing catalyst is simply time passing.
- Where does spot hold against the $78,000 max pain cluster? Two-thirds of listed Bitcoin options exposure sits in expiries whose max pain strikes cluster between $75,000 and $78,000. Sustained trade below $78,000 changes the hedging math materially.
- Does the December 25 curve steepen further? If long-dated protection keeps getting bid while front-end vol stays anchored, the market is pricing a structural event rather than a pullback, and the next repricing will be large in both directions.
None of this needs a directional call on Bitcoin to be useful. It only requires accepting that Bitcoin options are currently the cheapest hedge in the building, and that cheap hedges right before a repricing transfer wealth from sellers to buyers, or the reverse if you are on the wrong side of that trade.
What This Means for the Wider Crypto Market
There is a broader implication. Total crypto turnover of 2.3% of market cap, alongside a 4.3% drawdown in total capitalization in a single day, describes a market with thin liquidity and wide implied ranges. When spot liquidity is thin, Bitcoin options do not just price risk. They end up setting it.
For traders, premium selling on the front end of the Bitcoin options curve is currently the most crowded expression of a view on this tape. For long-term holders the implication is muted but not trivial: a market where roughly 70% of listed option exposure sits in two expiries, with implied volatility below realized, is a market where the next repricing tends to be violent rather than gradual.
Coverage from CoinDesk and derivatives reporting from Cointelegraph both frame this tape as indecisive. The curve says something sharper. Watch the curve, not the candle. Right now it is telling you that Bitcoin is priced for a very boring month, and the tape is not obligating anyone to agree.
Conclusion: Cheap Vol Is Not Calm
The data underneath tells a different story. Realized volatility over the past week ran 30.8% against an implied curve that bottoms out at 20.7%. Call-heavy open interest is concentrated in two expiries whose max pain strikes sit below spot. And long-dated implied volatility at 38% to 40% says hedging is being bought for reasons that have nothing to do with the next seven days.
Low implied volatility is not the absence of risk. It is the absence of the premium that pays you for holding it. That distinction is the entire trade, and it is worth remembering before the front end of the Bitcoin options curve gets repriced.
Disclaimer: This article is for informational and educational purposes only and does not constitute financial, investment or legal advice. Cryptocurrency investments involve substantial risk of loss. Always conduct thorough research and consult with qualified financial advisors before making investment decisions. Past performance does not guarantee future results.