Ethereum Owns the Users. Bitcoin Owns the Hard Money.
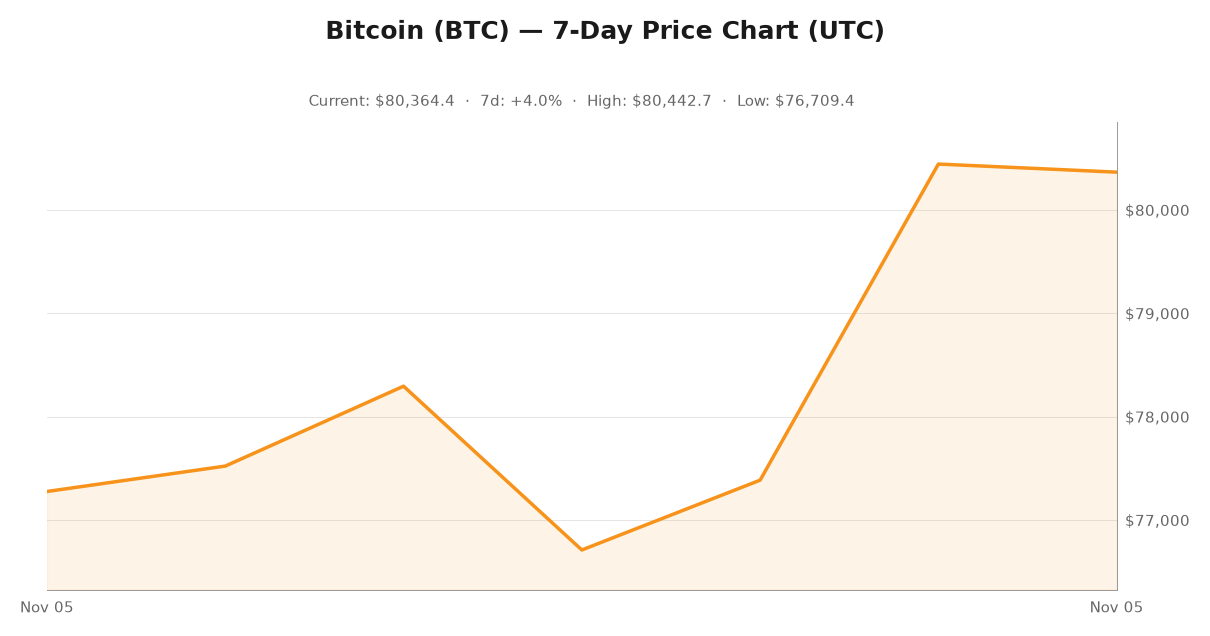
Here is a number that should bother anyone holding both assets: as of November 5, 2026, Ethereum’s decentralized finance ecosystem holds roughly $45.7 billion of total value locked, while Bitcoin’s DeFi sector holds about $4.28 billion. Ethereum’s on-chain footprint is more than ten times larger than Bitcoin’s.
Now look at the market caps. Ethereum sits at $295.5 billion. Bitcoin sits at $1.62 trillion. Ethereum is worth roughly 18% of Bitcoin.
Put those two facts side by side and you get the most uncomfortable chart in crypto: the asset with vastly more actual utility carries about one-fifth the monetary value. This is not a market that mispriced Ethereum for the first time. It is a market that decided something specific — that Ethereum is a productive tool and Bitcoin is a reserve — and it is not willing to pay for productive tools at reserve prices.
The burn is now a rounding error
Start with the mechanism that was supposed to fix this. EIP-1559, which shipped in August 2021, burns the base fee on every transaction on Ethereum. The pitch was straightforward: as activity rose, the chain would turn deflationary, and the ETH burned would eventually compete with the issuance coming out of staking. The EIP-1559 specification is still doing exactly what it says.
The problem is the scale of the number it is now burning.
- Ethereum fees, last 24 hours: $412,085
- Ethereum fees, last 30 days: $21,395,190
- Ethereum fees, trailing 12 months: $179,884,765
- ETH actually burned, last 30 days: $7,013,035
- ETH market cap: $295.5 billion
Annualize the trailing 30 days of burns and you get about $84 million against a $295.5 billion market cap. That is 0.028% — roughly three basis points of offset against the supply the chain adds through staking. Annualize the full fee take, burn included, and you get roughly $257 million, or 0.087% of market cap.
Put differently: at current prices, the network is burning on the order of 53 ETH per day. ETH’s supply is a bit north of 120 million. The entire deflationary mechanism removes about one twenty-thousandth of the supply every year. Over the trailing twelve months the chain collected $179.9 million in total fees — about 0.06% of its own market cap, in a year.
That is not a bug. It is a design choice meeting reality. When transactions moved to rollups, the fee demand that once justified a hard monetary premium moved with them — and so did the burn.
The fee market is recovering, from a very low floor
Here is the counterpoint worth stating plainly: fees are rising. October 31 produced $173,508 in daily fees on Ethereum. November 3 produced $431,032. The last seven days have averaged about $1.81 million per day, versus $713,000 across the trailing 30. The fee market is now running at roughly 2.5x its recent average, and the recovery has been fast.
That is a real signal, and anyone dismissing this chain’s economics entirely is ignoring it. But a fee market that needs to grow roughly 100x to make a real dent in a $295 billion market cap is not monetary policy. It is a toll booth. And toll booths pay for infrastructure. They do not create reserve demand.
The TVL rebound is a price illusion
Between October 30 and November 5, Ethereum’s DeFi TVL went from $42.93 billion to $45.72 billion, a 6.5% jump. That looks like a recovery in usage. Mostly, it is not.
Over the same six sessions, ETH went from $2,249.50 to $2,416.00, up 7.4%. TVL denominated in dollars rose slightly less than the price of the asset those dollars are denominated in. Read the series in ETH instead of dollars and the rebound is a rounding error: this is price beta, not new deposits.
Context for how much ground the ecosystem has to cover: on October 7, that TVL stood at $50.90 billion. Fifteen days later it is $45.72 billion. Meanwhile the token is down about 10.4% over the past 30 days against Bitcoin’s 6.1% decline. The bleeding is consistent.
ETH/BTC has been telling us for weeks
The cleanest summary of the whole debate is the ETH/BTC ratio, which measures how many bitcoin one ether buys. It closed at 0.03153 on October 7 and at 0.03006 on November 5. Between October 15 and November 4 it posted 21 straight daily closes below 0.0300, bottoming at 0.02890 on October 30 — the same session Bitcoin dropped to $77,839 and the TVL on the second-largest network cracked $43 billion.
Nothing about the ratio looks broken. It has spent the better part of a decade below 0.05. What is notable right now is that the ratio is falling while Ethereum’s TVL recovers, which means the marginal buyer is choosing Bitcoin exposure over this asset in a month when the on-chain footprint looked like it was healing.
Where the growth is actually going
Chain-by-chain numbers make the structural problem visible. Ethereum’s first layer still leads with $45.85 billion in TVL, but the challengers are not fringe:
- Base: $6.18 billion
- Hyperliquid L1: $2.56 billion
- Arbitrum: $1.49 billion
- Monad: $0.93 billion
- Polygon: $0.64 billion
- Avalanche: $0.60 billion
- Ink: $0.20 billion
Every one of those chains settles through Ethereum. Most of them pay the base layer a trivial fee for the privilege. The value lands on the rollups, the applications and the users — and the fee line shows what the toll is worth to the chain doing the settling.
The settlement tax is close to zero
That is the trade this ecosystem actually made: give away the fee market to buy the settlement role. It worked. Ethereum is the base layer for most of the activity above it, and much of that activity would not exist without it. It is just that the token collecting the smallest share of the economics is the one the market prices like a reserve asset.
One more number makes the asymmetry concrete. In the last 24 hours, the network collected $412,085 in fees, of which $128,912 was permanently burned and the remainder went to validators as priority fees and MEV. So roughly a third of everything the chain takes in actually leaves the supply. On a market cap of $295.5 billion, that revenue line is not the foundation of a monetary asset. It is an operating expense.
What would change the verdict
None of this is a prediction. Here is what would falsify the thesis, and it comes down to three numbers worth watching:
- Daily fees holding above roughly $1 million. At that level, burn annualizes past $100 million and the supply story stops being a rounding error.
- Staked ETH falling while fees rise. That combination means more supply is being locked than created — the first real sign of net deflation.
- ETH/BTC reclaiming 0.0315 and holding it. The ratio has spent 21 sessions below 0.0300. A sustained reclaim of the October 7 level would say the market is repricing Ethereum, not just Bitcoin.
And for Bitcoin holders, the same data cuts the other way. Ethereum’s fee market is structurally small, its DeFi TVL is denominated in ETH and therefore hostage to ETH’s own price, and its largest remaining value driver is a token that cannot be pulled out of an exchange in a hurry. Bitcoin’s monetary premium does not come from DeFi TVL of $4.28 billion. It comes from being the asset people hold when they are not holding anything else.
The bottom line
Ethereum has the better technology, the bigger DeFi footprint and the faster-growing fee market of the two, and it captures a rounding error of the value that creates. Bitcoin has almost none of the utility and captures the reserve premium anyway. The market is not confused. It is pricing two completely different assets, and as of November 5, 2026, ETH/BTC at 0.0301 says it has not finished pricing the difference. If you hold both, the ratio, not the total, decides your outcome.
Live data for this analysis is available on CoinGecko’s Ethereum page, DeFiLlama’s TVL dashboard and DeFiLlama’s Bitcoin dashboard. Prices and TVL figures are snapshots taken on November 5, 2026 and will drift.