Crypto Market Pulse: October 15, 2026
Top of the tape today: Bitcoin Sinks Toward $80,000 After Hot CPI. Will Whales Keep What They Added?, per BeInCrypto — and it’s landing while BTC trades at $81,296, -2.49% over the past 24 hours. Total market cap sits at $2,715,628,222,436 (-5.70% on the day). The headline matters, but the price action is where the rubber meets the road. Here’s the full read.
The Lead Story: Bitcoin Sinks Toward $80,000 After Hot CPI. Will Whales Keep What They Added?
Macro is back setting the tape, and BeInCrypto is reporting reinforces the linkage between traditional finance conditions and crypto prices. Today’s weakness is the macro overhang expressing itself through risk assets, and the correlation with traditional risk assets continues to tighten.
The plumbing: the Fed’s policy stance is the single biggest macro variable for the bitcoin market. Rate cuts lift risk assets by reducing the discount rate on future cash flows. Hawkish surprises pressure everything from equities to crypto. Dollar strength adds another layer — stronger dollar is structurally bearish for bitcoin (priced in dollars), weakness lifts all dollar-denominated assets. Treasury yields complete the picture: when the 10-year rises, the opportunity cost of holding non-yielding bitcoin increases.
The correlation trade: bitcoin and the Nasdaq have tightened their daily correlation significantly in recent years. Both are long-duration risk assets in the eyes of the marginal buyer, and they react to the same macro inputs with the same lag. If you’re trading one, you should be watching the other. The days of bitcoin trading as a pure idiosyncratic asset are largely behind us.
The patience trade: macro cycles resolve over weeks and months, not days. Today’s -2.49% move on bitcoin is consistent with the macro overhang and does not change the structural picture. For long-term allocators, the macro noise is best filtered out — bitcoin’s response to macro shocks has historically been sharp but transient, recovering within weeks of any given FOMC meeting or inflation print.
What would change the picture: a sustained move in real yields (not just nominal) is the macro variable that would actually break bitcoin’s structural thesis. Real yields well above 2% historically compress multiples across all risk assets; real yields below 1% historically expand them. Watch the 10-year TIPS yield, not just the headline 10-year.
The geopolitical dimension: macro isn’t just rates and inflation anymore. Treasury sanctions, dollar weaponization, and the search for neutral reserve assets have become a parallel driver of crypto demand. Several sovereign actors are now exploring bitcoin as part of reserve diversification. That doesn’t show up in macro prints, but it does show up in on-chain accumulation patterns. The geopolitical angle is the wild card that traditional macro frameworks miss — and it’s increasingly relevant for anyone with a multi-year horizon.
The seasonal pattern: crypto markets have well-documented seasonal tendencies. Q1 tends to be constructive on tax-loss buying and fresh allocation flows. Q2 is choppy as summer positioning thins out. Q3 brings the weakest historical returns as liquidity drains. Q4 is historically the strongest as portfolios rebalance and tax considerations create a year-end bid. Where we are in this calendar matters for how much weight to put on any single day’s tape.
BTC Price Action: October 15, 2026
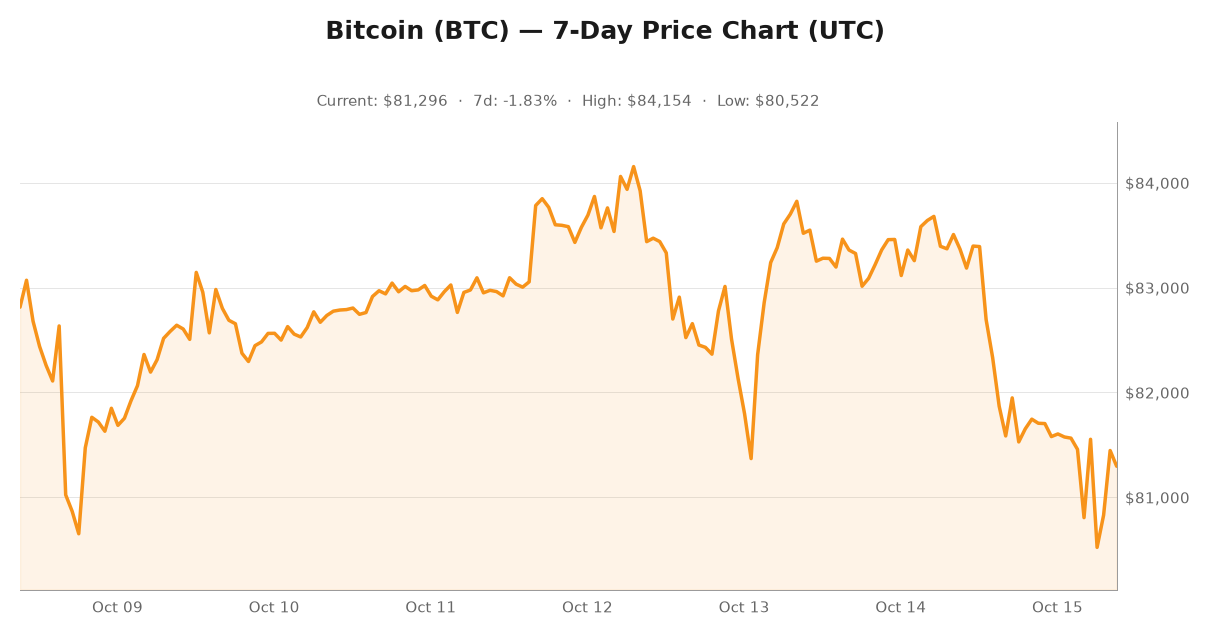
BTC sat at $83,185.9 24 hours ago. Now it’s at $81,296 — a -2.49% move on the day. The 24-hour volume of $41 billion is elevated, and over the past seven days the range has been $80,521.52 to $84,154.06, currently down -1.83% on the week.
For traders, the levels that matter:
- Immediate support: $82,132
- Major support: $80,522 (7-day low)
- Immediate resistance: $85,416
- Major resistance: $84,154 (7-day high)
The setup: a controlled pullback that hasn’t broken structure. The 7-day range is still holding, and the bid is showing up where it should.
Volume confirms the price action: $41 billion over the past 24 hours is elevated, with active two-way flow rather than one-sided capitulation. Funding rates on perpetual futures are flipping slightly negative, indicating short positioning is building after the rejection — historically a setup that resolves with a relief bounce once sellers exhaust.
Today’s Crypto Price Tracker
While BTC trades at $81,296 (-2.49%), here’s how the rest of the top 10 is performing over the last 24 hours:
| Coin | Price (USD) | 24h Change |
|---|---|---|
| Bitcoin (BTC) | $81,296 | -2.49% |
| Ethereum (ETH) | $2,372.52 | -5.26% |
| Solana (SOL) | $103.2500 | -3.46% |
| XRP | $1.3200 | -3.75% |
| Cardano (ADA) | $0.2225 | -5.23% |
| Avalanche (AVAX) | $9.6500 | -5.19% |
| Chainlink (LINK) | $12.1400 | -6.12% |
| Dogecoin (DOGE) | $0.0803 | -4.85% |
| Polkadot (DOT) | $1.0990 | -3.83% |
Every major altcoin is red this morning — synchronized deleveraging rather than altcoin-specific weakness. When BTC drops +2.49% and every altcoin follows, the move is almost always macro-driven, not story-driven.
Market Cap & Dominance
- Total market cap: $2,715,628,222,436 (-5.70% 24h)
- 24-hour volume: $47,236 billion
- BTC dominance: 60.0%
- Ethereum dominance: 10.6%
BTC dominance at 60.0% is elevated — classic risk-off signature, capital rotating into the flagship as the relative safe haven of the space. Volume at $47,236 billion is elevated, indicating active repositioning
The Setup for the Next 72 Hours
Several factors could move the market before the next post:
- Macro data and Fed speak: Inflation prints, jobs reports, and Fed speeches will continue to set the risk-asset tone. A hot surprise pressures BTC lower; a dovish surprise gives it room.
- Spot ETF flows: Daily net flows from U.S. spot ETFs remain the single biggest near-term price driver. Watch the morning print for direction.
- Headline follow-through: Today’s lead story (Bitcoin Sinks Toward $80,000 After Hot CPI. Will Whales Keep What They…) will likely see additional coverage in the next 24 hours — each new development is a potential catalyst.
- Technical levels: A daily close above $85,416 invalidates the bearish setup; a daily close below $82,132 signals deeper correction toward $80,522.
The Bottom Line
October 15, 2026’s snapshot: a controlled pullback within a still-intact structure. BTC is down +1.83% on the week despite today’s +2.49% move — and that’s the read that matters for anyone with a multi-day horizon.
Today’s lead headline — Bitcoin Sinks Toward $80,000 After Hot CPI. Will Whales Keep What They Added? — is a reminder that this market increasingly responds to a much broader set of catalysts than it did in prior cycles. The institutional layer, the regulatory layer, the macro layer, the technology layer — they’re all in play now. The trade is to keep all of them on the dashboard rather than fixating on any one.
For tomorrow’s post: keep an eye on the morning ETF flow print, any follow-on coverage of Bitcoin Sinks Toward $80,000 A, and whether BTC can hold the $82,132 area on any overnight weakness. That’s the playbook until the next session.