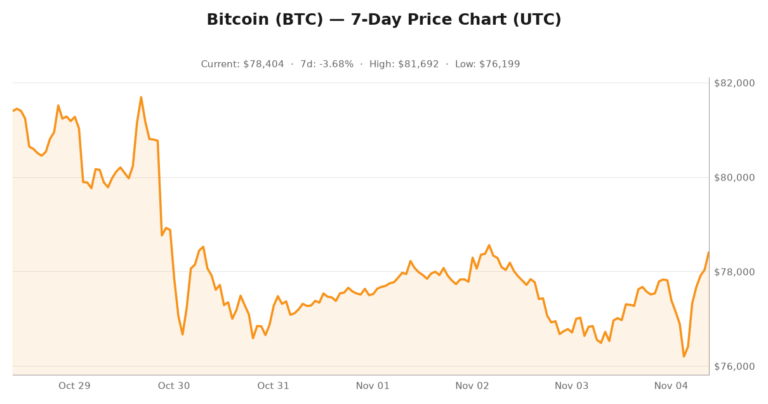
Something strange happened on Bitcoin on Sunday, November 15, 2026. The network recorded 963,618 transactions — the highest daily count in the trailing 365 days, according to the Blockchain.com transaction chart. On the same day, Bitcoin slid into a four-month low near $62,000, and the broader crypto market was sold off hard. Those two facts should not sit next to each other. For most of the last cycle, they never would have.
There is a catch, and it matters more than the headline. A transaction count is a raw event count, not a demand measure, and one session is a sample, not a trend. But when the busiest day of the year lands on the worst price tape in a quarter, the on-chain record is telling you something about what is actually driving Bitcoin right now — and it is not the story the price action is selling.
Two numbers that should not exist together
The price tape
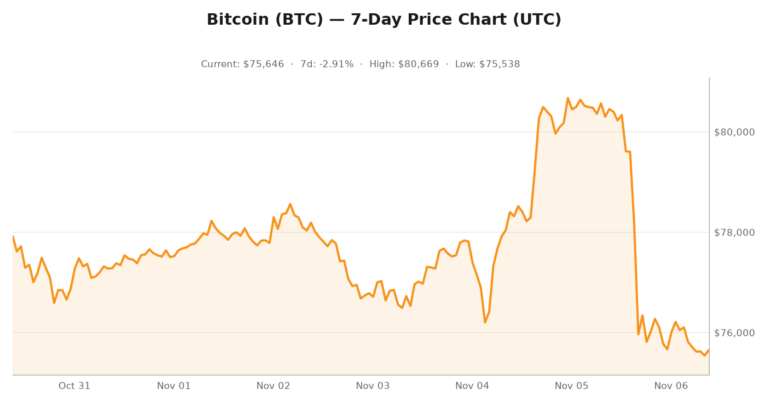
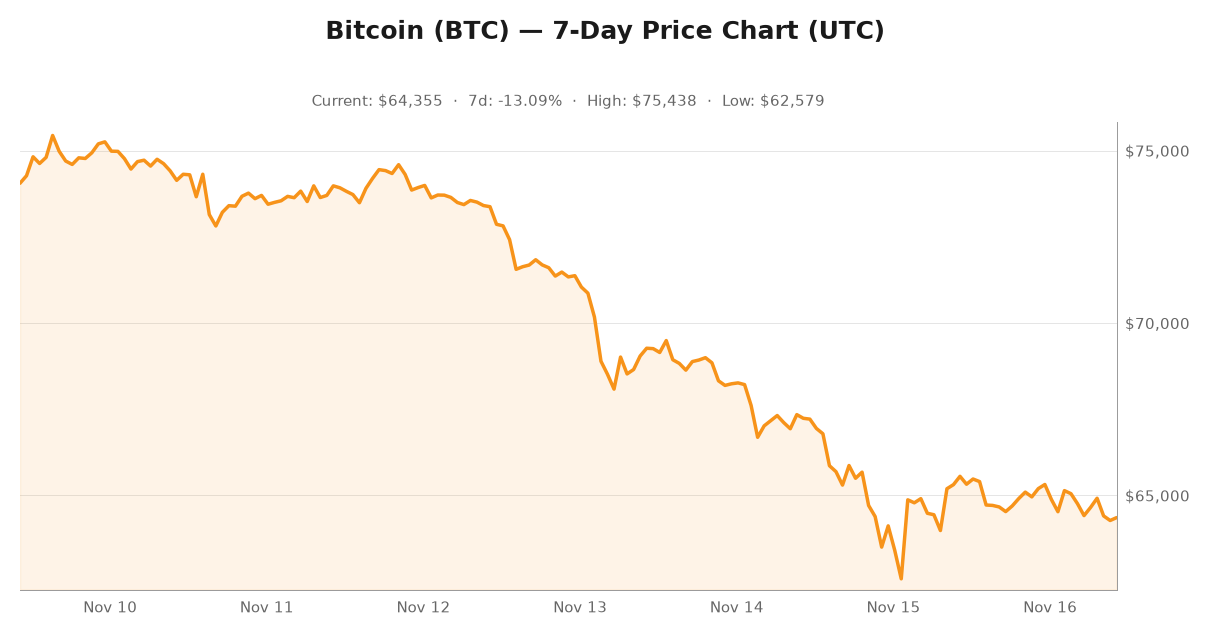
Start with price. Bitcoin closed at $75,744 on November 7. Nine sessions later, on November 16, the daily close was $65,300. That is a 13.8% decline in nine days, with the low printing near $62,000 on November 15 — the worst level since July, as Cointelegraph reported.
- Nov 7: $75,744
- Nov 11: $73,722
- Nov 13: $71,365
- Nov 14: $68,232
- Nov 15: $64,119
- Nov 16: $65,300
The transaction spike
Now the other number. On November 15, Bitcoin processed 963,618 transactions. The day before, it processed 465,786. That is a 106.8% jump in a single session, and it is the highest daily figure in the last full year of chain data — well above the October peak of 913,196, and roughly double the 2025 average of about 420,000 transactions per day.
One of these numbers is a price. The other is usage. In a healthy market they move together. During Bitcoin’s November 2026 drawdown they did not, and the reason is more interesting than either the rally cheerleaders or the bears are telling you.
Price action: a 14% slide with no bid for block space
The tape has been one long liquidation ramp. And the dollar volume moving across Bitcoin has been falling even faster than the price. Blockchain.com’s estimate of transaction value put roughly $12.6 billion moved across the network on November 12, $9.9 billion on November 13, $4.8 billion on November 14, and $6.6 billion on November 15 — the very day transaction count hit its yearly high.
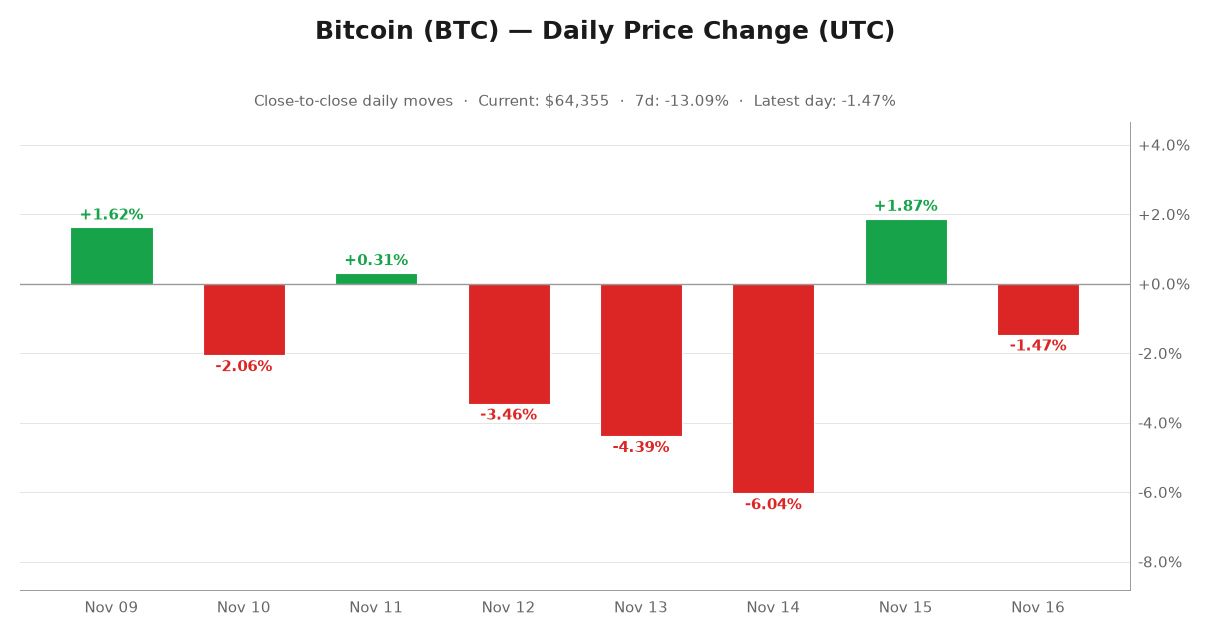
Run that against price and you get the picture in one line: fewer dollars moved across Bitcoin in mid-November than a month earlier, even as the raw number of transactions more than doubled. Event count went up. Value moved went down. That is the opposite of what genuine new demand looks like, and it is the first crack in the bullish reading of the record day.
The catch: fewer wallets, more transactions
Here is where the “busiest day in a year” framing falls apart. On November 15, unique active addresses on Bitcoin fell to 444,989, down from 490,905 on November 14 and 544,418 on November 13. Transactions per active address went from 0.95 to 2.17 in a single session — a jump of roughly 128%.
- Transactions: 465,786 to 963,618 (+106.8%)
- Unique active addresses: 490,905 to 444,989 (-9.3%)
- Transactions per active address: 0.95 to 2.17 (+128%)
- Average cost per transaction: $61.03 to $35.94 (-41.1%)
A doubling of transaction count alongside a 9% drop in active wallets is the signature of batching, custodial churn, and automated activity — not of new people arriving. Exchanges consolidating deposits, wallets sweeping change, bots cycling funds, and on-chain routing infrastructure all produce exactly this shape: more events, fewer participants. So the honest read of November 15 is activity without user growth, and that distinction is the whole ballgame for anyone trying to read this tape.
Fees at 1 sat: why the busiest day was also the cheapest
The cost of moving value on Bitcoin collapsed alongside the price. Average cost per transaction fell from $61.03 on November 14 to $35.94 on November 15 — a 41% drop in one session — and mempool.space was showing recommended fees of 1 sat/vB across every tier, with the mempool sitting near 30 MB.
Why block space got cheap
The supply side explains the collapse better than any demand story:
- Hash rate reached roughly 1.15 EH/s on November 15, with the three-month average near 1.0 EH/s on mempool.space
- Difficulty fell twice in three days: 148.4T (Nov 6) to 136.6T (Nov 14) to 134.8T (Nov 15) — down 9.1%
- Pool concentration stayed high: the top three pools mined 62.4% of last month’s blocks, the top four 71.3%
Block space is a commodity, and in November 2026 it was in oversupply. When hash rate expands faster than fee bids, the marginal cost of a transaction goes to zero. That is why the busiest day of the year could also be the cheapest day of the year — and why Bitcoin’s transaction count can spike while value transfer weakens. A bigger network moving the same money in more, smaller pieces looks identical to a growing network on a chart of raw events.
It cuts the other way for holders. Bitcoin produces roughly 450 new coins per day against a supply of about 20.11 million, and with fees pinned near the floor, that issuance is monetized by almost nobody. Cheap is excellent for users. It is not the same thing as valuable.
What Bitcoin’s capital markets still look like
Raw activity is not a financial ecosystem. On DefiLlama, Bitcoin’s total value locked sits at roughly $3.4 billion. Ethereum holds about $37.7 billion, Base about $5.1 billion, Solana about $4.7 billion, and Tron about $4.3 billion.
So the activity behind that record transaction day was overwhelmingly transfers and settlement — coins moving, coins consolidating, value changing hands between wallets that already existed — rather than capital formation. Bitcoin’s chain usage is real, and it is growing, but most of what it does is move balances rather than build anything financial on top of itself.
What would actually confirm demand
If you want to know whether this is genuine growth or statistical noise, these are the numbers to check, in order of usefulness:
- Active addresses and transaction counts rising together. One without the other is churn, batching, or bot activity. Both together is a new cohort of users.
- The fee rate holding above 2-3 sat/vB. A fee market that stays at the floor means block space is overbuilt relative to demand, regardless of event counts.
- Estimated dollar volume rising while raw counts stay flat or fall. That is the signature of larger transfers per transaction, which is what actual settlement looks like.
- Lightning channel capacity and payment counts. Bitcoin’s off-chain rail is the best available proxy for whether people are actually paying each other, rather than reshuffling coins between custodial accounts.
- Coin-days destroyed. Long-term holder spending separates conviction from churn — the metric most dashboards skip.
None of these need a price chart to interpret. A chart on a 4-month low tells you sentiment. Chain metrics tell you what is being built.
The contrarian case, stated honestly
There is a real argument here, and it is not a price argument. Bitcoin processed a record number of transactions in the same week its price fell nearly 14%, while the cost of using the network roughly halved. Networks that keep clearing through a drawdown, with settlement this abundant and this cheap, are genuinely hard to dislodge. The chain did not break, the mempool did not back up, and the fee market did not seize up. Most assets do not get that test in their drawdown.
But the other side of the ledger is just as real: usage that is mostly custodial churn, at 1 sat fees, in a market where the marginal price setter is now a small number of large fund flows rather than on-chain participants, is not the same thing as demand. And the fact that Bitcoin’s DeFi footprint remains a fraction of Ethereum’s while its transaction count posts records tells you most of that activity is balance transfers, not capital formation.
That is a network under stress with surplus capacity: cheap and sticky, but shallow.
Bottom line
The record transaction day was a supply story, not a demand story. Block space got cheaper, miners pushed hash rate up, and the chain processed more small events while the dollars moved through it shrank. Bitcoin’s network activity is now running roughly 70% above its late-2025 pace even with price at a four-month low — that is genuinely more useful Bitcoin than the price chart suggests.
What it is not is proof that the selling is over. Watch four numbers in order: active addresses, the fee market, estimated dollar volume, and Lightning. If active addresses turn up while fees stay pinned at 1 sat, you are looking at cheap growth. If active addresses keep sliding while fees stay at 1 sat, you are looking at a quiet network with an expensive narrative.
Either way, the data is clearer than the tape. Follow internetwealthresource.com for daily Bitcoin on-chain analysis, fee-market breakdowns, and market structure coverage — plus the full chart history behind every number above.