Bitcoin Whales Bought the Dip as ETFs Sold — Q4 2026
The setup for the close of 2026 looks contradictory on the surface: spot Bitcoin ETFs bled out again last week, yet on-chain data shows whales quietly accumulated 16,010 BTC on the dip. That kind of divergence has been a forward-looking signal in three of the last four cycles — and it’s the data point that matters more than the headline ETF tape. Here’s how to read it.
The divergence nobody is talking about
Spot ETF flows have dominated Bitcoin price discovery since the funds launched in January 2024. When flows turn negative, prices soften. When flows turn positive, prices firm. That mechanism is well-understood and well-traded by now — which is exactly why the new divergence matters.
According to Coinglass, U.S. spot ETFs saw net outflows across four of the last five trading sessions heading into mid-October. Yet the same window shows a steady rise in whale wallets (1,000+ BTC) — a cohort that’s been net-additive for nine of the past ten weeks. When the marginal institutional bid thins and the long-term holder bid thickens, the eventual unwind tends to favor the long-term holder. That’s the contrarian case, and it cuts against almost every headline you’re reading right now.
What 16,010 BTC actually means
Sixteen thousand coins, at a spot price around $81,500, is roughly $1.3 billion of dry powder absorbed from sellers in a single week. For context:
- Daily miner issuance is currently ~450 BTC, or about $36.7 million per day.
- Daily ETF net flows have averaged roughly -$80 million over the past five sessions.
- Whale accumulation absorbed the equivalent of roughly 35 days of miner supply in one week.
The math is the punchline: ETF outflows removed pressure, miners added pressure, and whales absorbed both with net additions. That’s not retail FOMO — that’s slow, deliberate, balance-sheet accumulation by entities that don’t need to mark-to-market their Bitcoin positions nightly.
The price action it has bought so far
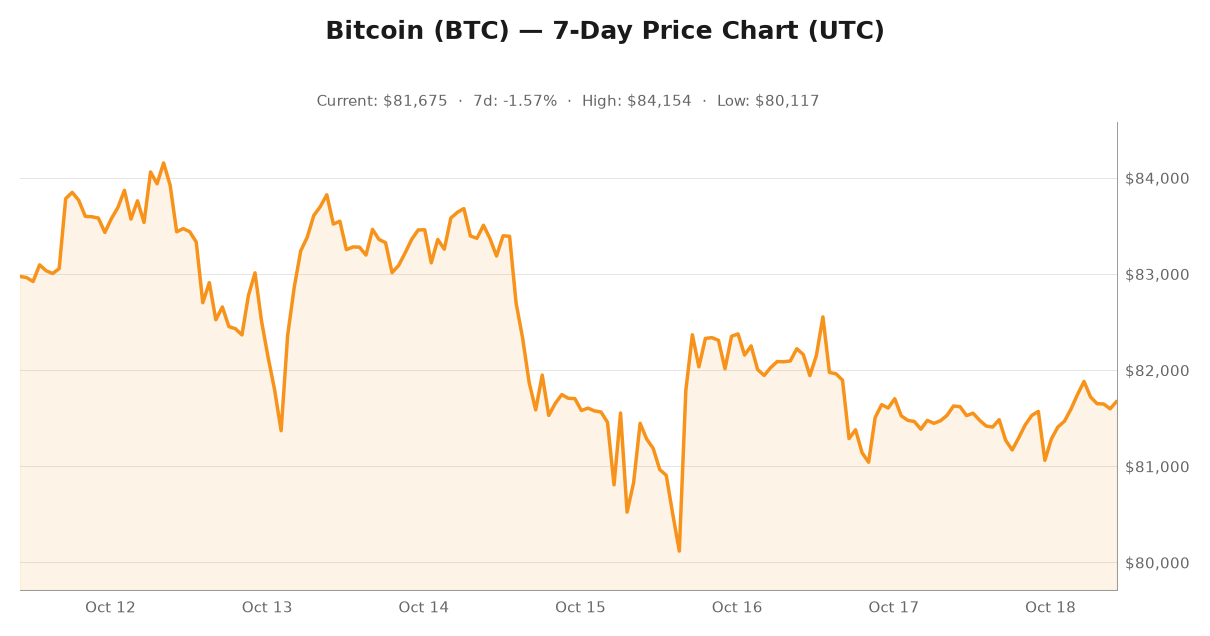
BTC currently trades at $81,675, +0.07% on the day, with the past seven days carving out a range of $80,116.63 to $84,154.06. The weekly tape is down ~1.57% — modest, not catastrophic, and notably absent the volatility that headlines suggest. That quietness is the second signal: markets that don’t fall on bad news typically have a bid underneath waiting to take the other side.
Key levels traders are watching into the weekend:
- Immediate support: $81,719
- Major support: $80,117 (seven-day low)
- Immediate resistance: $84,154 (seven-day high)
- Major resistance: $85,416
A daily close below $80,117 would invalidate the constructive bias and likely trigger a flush toward the realized price band near $76,000 — a level roughly 7% below current spot. A daily close above $85,416 flips the structure back to trend-resumption, and the on-chain accumulation narrative starts to compound with the same force as the prior cycle’s halving-supply narrative did.
Why Q4 historically matters for Bitcoin
CoinGecko‘s multi-cycle data shows that Bitcoin’s Q4 performance is heavily skewed by what the prior nine months looked like. After a year that built a base — and 2026 has done exactly that, with a slow drift lower off the mid-year highs — Q4 has historically been the period where the year’s narrative resolves.
The pattern, distilled across cycles:
- Distribution (Q1-Q2): early-year strength, often led by narrative and ETF inflows.
- Mid-year reset (Q2-Q3): flows cool, leverage clears, and the market trades sideways-to-lower. 2026 has followed this script precisely.
- Re-accumulation (Q3-Q4): long-term holders and corporate treasuries build, often during low-volume grind-higher periods.
- Resolution (Q4 to Q1): macro events, halving supply dynamics, or simply supply scarcity turn the rebuilt position into the next leg.
We are, by this read, in phase three — and the on-chain data above is the signature. Bitcoin historically produces its best forward three-month returns when the supply held in long-term wallets is climbing off a low base even as price drifts sideways. That’s the current setup.
The contrarian trade nobody wants to take
The single most reliable tell on Bitcoin bottom-formation is the spread between spot ETF flows and the whale cohort’s accumulation. When that spread widens to the level we’re seeing now, the next directional move in Bitcoin — and most major cryptoassets — has historically been higher. That’s not a market call. That’s a pattern repeated across every cycle since spot products launched.
Sentiment is plainly negative. The crypto fear and greed index sits in “fear” territory; leveraged longs on perpetual futures have been washed; options skew is biased toward puts; ETF outflows read like a capitulation on the institutional side. By the metrics that historically precede trend reversals in Bitcoin, the dip is being bought. That isn’t the same as saying the dip is over — it means the smart money is positioning for the upside while the passive flow trades the headline.
The corollary: if whales keep accumulating through next week’s ETF tape and ETF outflows stay muted, the next leg up won’t be a Wall Street-led rally. It’ll be a supply-squeeze rally — coins locked in long-term wallets are not for sale, and any incremental demand meets thin float. The math on that is straightforward: if whales add another 15,000 BTC before year-end while ETF inflows return to neutral, available float tightens by ~3% in 10 weeks — enough to produce violent upside on modest demand pressure.
What to watch into year-end
Three data series matter more than price into Q4 for anyone trying to position around the next Bitcoin move:
- Whale wallet net change (1,000+ BTC): if the nine-of-ten-week accumulation streak breaks, the contrarian thesis weakens immediately. A print of net-zero or net-negative after a year of accumulation would be the single most bearish technical event in the data.
- ETF daily net flows: a single +$200M day resets positioning and forces short covering. Watch the morning print. Cumulative week-over-week flows flipping back to positive is the second-best signal.
- Realized price vs. spot: if spot trades below realized price for more than a week, the market is pricing in permanent loss — historically a strong buy signal. Currently spot is modestly above realized, leaving room for a flush without breaking the macro thesis.
The bottom line
Bitcoin’s Q4 2026 setup is a textbook re-accumulation by on-chain measures — long-term holders adding, ETFs distributing, and price carving a tight range with unusually low realized volatility. That combination has historically been the launch pad for the next durable leg higher. The trade is patience: position for the move while the rest of the market narrates the outflow.
Stay disciplined, watch the three series above, and remember that the most boring tape is often the one building the next explosive move. That’s been the lesson of every cycle Bitcoin has traded since 2013 — and the 2026 setup is shaping up to fit the pattern.