Bitcoin trades near $74,400, roughly 40% below the October 2025 record of about $124,750. There are plenty of explanations on offer: ETF redemptions, regulatory pressure, a crowded long trade gone wrong. Here is the one nobody wants to say out loud. Over the same two years that gold gained 56%, BTC lost 16%. Over the past twelve months, gold was flat and BTC lost 30%. The asset that was supposed to be digital gold has been beaten by the thing it was named after.
That is not a feel-good chart. It is a competition. And its competitors in November 2026 are not Ethereum or another memecoin cycle. They are a vault in Switzerland and a ten-year Treasury note paying 4.86%.
Below is the scoreboard, the flow data, and the correlation shift that together explain where Bitcoin stands today. No price predictions, no hand-waving, just the numbers the crypto commentary keeps skipping.
The Scoreboard Nobody Argrees About
Pull daily closes for the last two years and the picture is unusually clean. Every figure below comes from closing prices pulled on November 10, 2026, with spot BTC cross-checked on CoinGecko.
- Bitcoin: $74,356 — down 40.4% from its October 6, 2025 record of $124,752, down 29.9% over twelve months, down 16.2% over two years.
- Gold (COMEX front month): $4,092 — up 56.3% over two years, but down 23.1% from its January 29, 2026 peak of $5,318.
- S&P 500: 7,549 — only 3.4% below its record close of 7,818 set on October 6, 2026, and up 25.8% over two years.
- Dollar index: 101.7 — up 3.5% so far in 2026, so the dollar actually got stronger this year while BTC got weaker.
- 10-year Treasury yield: 4.86% — up roughly 70 basis points year to date, and only 45 basis points below its October 5 high of 5.31%.
- Total crypto market cap: $2.48 trillion — shrinking 2.8% in the last 24 hours, with BTC dominance at 60.3%.
Read those six lines together and one conclusion is unavoidable: this was not a risk-off year for hard assets. Stocks sat near records. Gold ran 56%. The dollar firmed. What happened to Bitcoin is not a story about global panic. It is a story about capital choosing something else.
Price Action: Three Ugly Phases in 2026
Bitcoin did not drift lower in 2026. It broke, then rallied hard, then gave it back. The daily closes tell the story in three moves.
- January to June: down 34%. Bitcoin closed 2025 near $88,732 and set its 2026 high at $96,929 on January 14. By June 30 it traded at $58,559. That is a $38,000 round trip in six months, and a reminder that 2026 began with a genuine bear market, not a slow bleed.
- July to early October: up 46%. From the June low, BTC produced a genuinely strong rally, recovering to $85,558 by October 6. Momentum traders had every reason to believe the bottom was in.
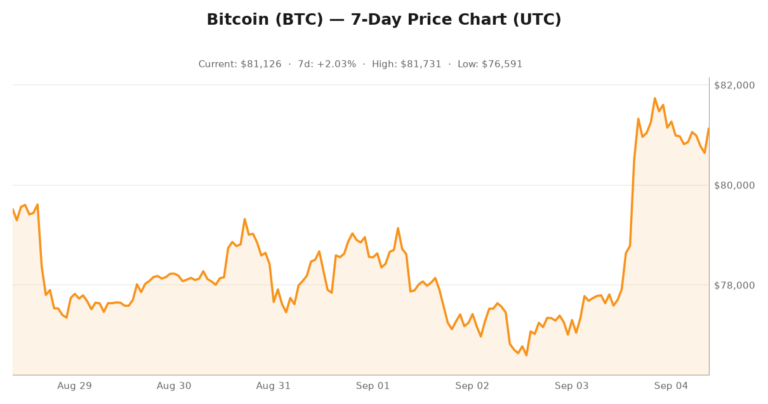
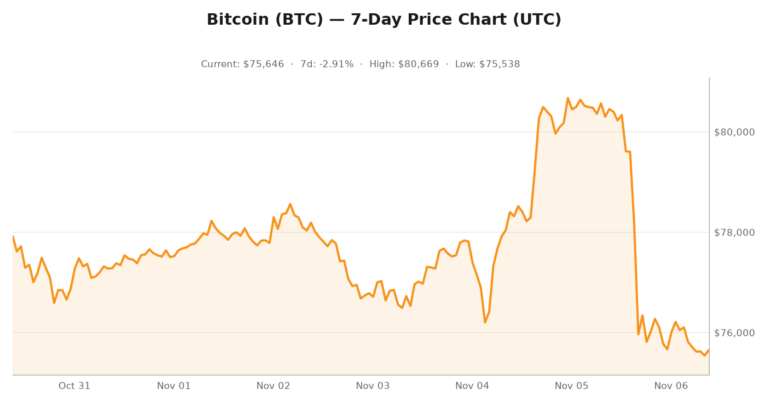
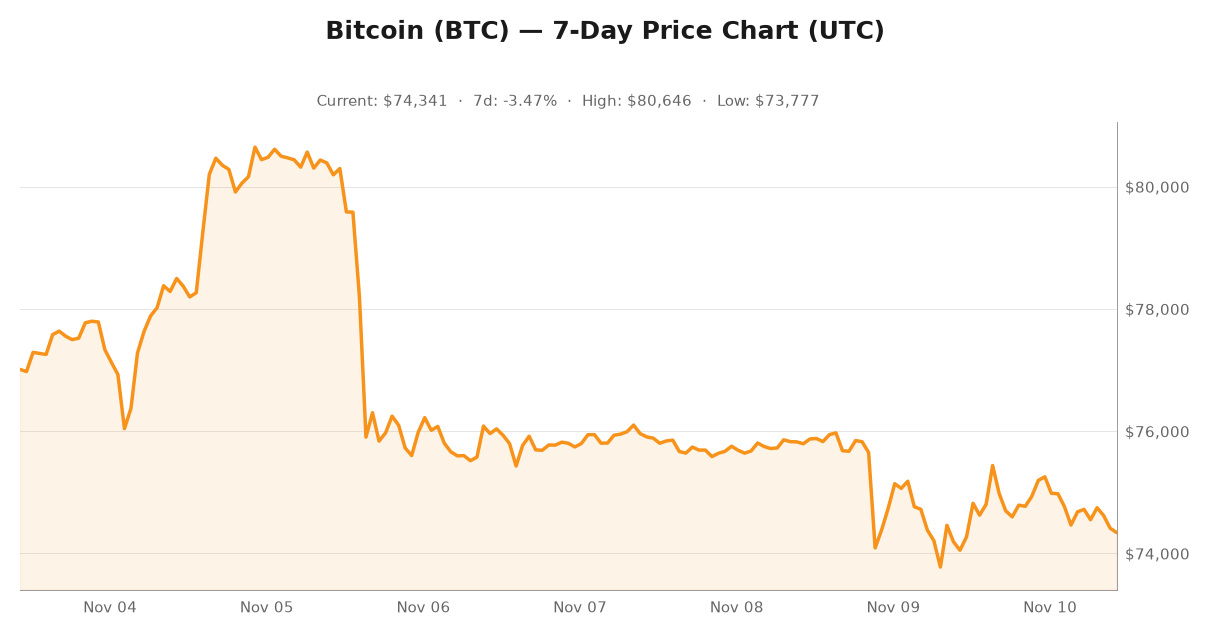
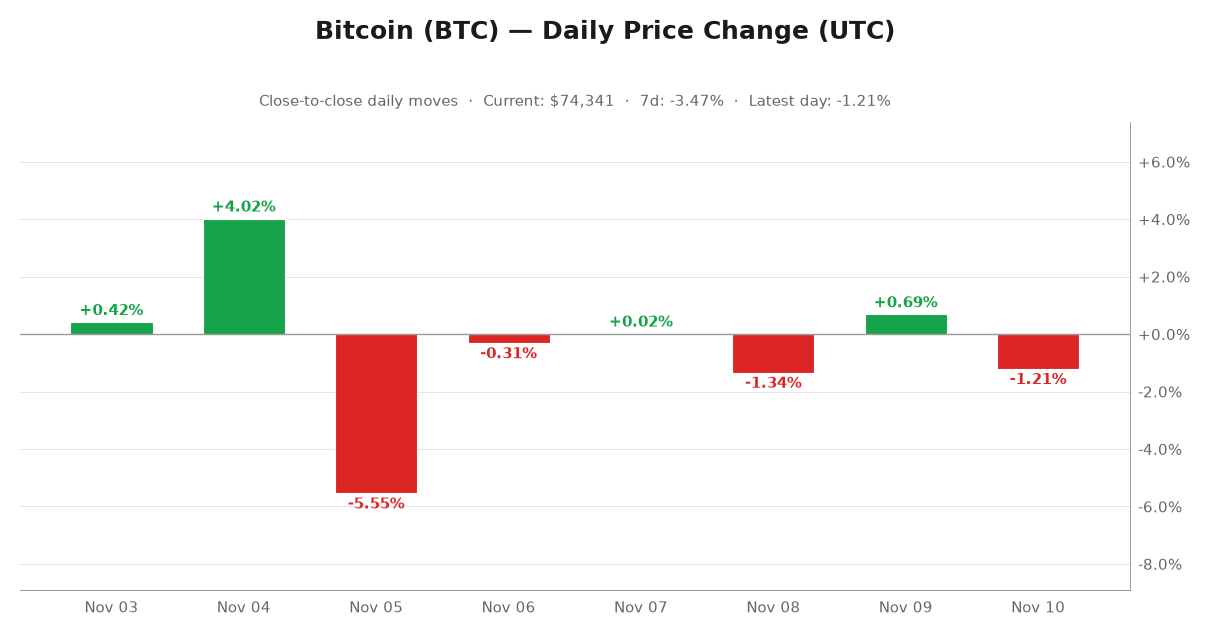
- The last five weeks: down 13%. That rally has been leaking since early October. Over the past seven sessions BTC slipped from about $77,010 to $74,341, with a weekly low near $73,777 and a high near $80,646.
Gold walked the same three phases, only smaller. It fell 24% from its January peak to $4,038 by June 30, and then it did almost nothing: up just 1.3% since June 30. Bitcoin has spent five weeks surrendering a rally. Gold has spent five months going nowhere. When you decide where to keep a hard-money allocation, one of those two outcomes is a hedge and the other is a trade.
The Gold to Bitcoin Ratio Is the Chart That Matters
One ratio compresses this entire argument into a single line: ounces of gold per Bitcoin.
- Today: 0.0550 ounces of gold per Bitcoin.
- One year ago: 0.0389 — a 41% move against Bitcoin.
- Two years ago: 0.0295 — the ratio has nearly doubled since then.
- February 23, 2026: 0.0809, the peak of the year while Bitcoin was still making its lows.
- October 6, 2026: 0.0489, the level that has to break for the trend to turn.
Those last two numbers matter more than any other pair. The ratio hit its 2026 high in February and its low in October, then gave ground again in November. The digital-gold premium was never really there in 2026. What was there instead was a metal bid that showed up first, peaked first, and held its gains while Bitcoin’s recovery faded.
Then There Is the 4.86% Problem
Here is the part of the bear case that gets brushed aside as boring: opportunity cost is a real price, and it has just been quoted.
A ten-year Treasury paying 4.86% means cash earns roughly 20 basis points every single day. A 1% move in Bitcoin, up or down, takes about five weeks of Treasury yield to match. Bitcoin pays nothing. Gold pays nothing. With the risk-free rate near two-year highs, both zero-yield assets have to work harder to justify their volatility, and only one of them has been working.
Look at what the yield did while BTC fell. The ten-year moved from 4.16% on December 31, 2025 to 4.86% on November 9, a 70 basis point rise in ten months, with BTC down 16.2% over the same stretch. That is the cleanest relationship in the whole dataset, and it points the wrong way for anyone hoping crypto simply follows equities higher.
The Flows Confirm the Rotation
ETF data shows you who was selling on Bitcoin. Here are the last six US sessions from the Farside tracker, in millions of dollars.
- BlackRock IBIT: -$1,422.7M — redemptions on five of six sessions.
- Fidelity FBTC: +$93.1M, with +$236.7M on November 4 immediately followed by -$199.9M on November 5.
- Bitwise BITB: +$16.6M. Ark ARKB: -$29.0M. Invesco EZBC: -$32.9M. Grayscale Mini HODL: -$23.6M. Grayscale GBTC: -$61.0M.
- Net across the eleven tracked funds: roughly -$1.43 billion.
Context matters. IBIT has taken in $64.9 billion net since January 2024, and GBTC’s cumulative -$28.1 billion is mostly the mechanical cost of converting a 2024 spot trust into a 2025 ETF. So these are not the flows of a wrapper collapsing. They are a steady, deliberate trim, the kind you see when holders are reallocating to something else rather than fleeing in panic.
The Correlations Changed Shape
Rolling correlations of daily returns make the regime shift visible.
- BTC versus gold, 90-day: +0.48 — a year ago it was +0.19.
- Bitcoin versus the S&P 500, 90-day: +0.46 — a year ago it was +0.60.
- Bitcoin versus the dollar index, 90-day: -0.26 — a year ago it was -0.12.
Two things are happening in that table. BTC and gold now move together twice as often as they did a year ago, which tells you they are being traded as a pair, and in that pair gold has been the winner while Bitcoin has been the loser. At the same time Bitcoin’s sensitivity to the dollar has roughly doubled, so the reflex that buys Bitcoin when the dollar weakens is still wired in. It simply is not enough on its own anymore. Over 180 days the dollar correlation is also -0.26, against roughly zero a year ago.
What Would Flip the Script
If you are watching for a turn, these are the levels that matter, and every one of them is checkable in seconds.
1. Gold’s June low
Gold is already 23.1% below its January 2026 peak. If it breaks the June 30 low near $4,038, the hard-money bid has room to run and BTC gets its turn. For a Bitcoin holder who is not trading intraday, this is the single most important number on the board.
2. The ten-year yield
Below roughly 4.2%, the carry argument against a zero-yield asset collapses and Bitcoin’s math improves quickly. Every 50 basis points of yield moves BTC more than any single day of ETF flows.
3. IBIT’s redemptions
Two consecutive weeks of net creations would tell you Bitcoin wrapper demand has returned. Until then, treat it as an asset being trimmed rather than one being accumulated.
4. The ratio
A reclaim of 0.065, roughly where the gold to Bitcoin ratio sat in June, says the trade has turned. Below 0.0489 says it has not.
What This Means If You Own Bitcoin
None of this says Bitcoin is broken. BTC still has deeper liquidity, cleaner settlement, a 24/7 market and a better long-run record than any other hard-money asset anybody has actually held. Gold does not settle a stablecoin. Bitcoin does not have a delivery problem.
But if you still call Bitcoin digital gold in November 2026, the numbers no longer support the label. Over two years the metal beat the “digital” version by more than 70 percentage points, and it did so while the dollar was not collapsing and stocks sat near records. That is not a crypto story. It is a relative-performance story, and relative performance is decided by opportunity cost.
The practical version of the argument is a three-sleeve portfolio. A hedge sleeve holding what actually hedged this year, meaning gold or Treasuries at 4.86%. A core crypto sleeve sized for the fact that 60.3% dominance means the crypto trade is now essentially a Bitcoin trade. And a small tail position for the upside scenario everybody is still hoping for.
Watch the ratio, watch the ten-year, and watch the IBIT tape. Those three charts told the story of 2026 before the price did. Check the live Bitcoin price and market cap on CoinGecko, the gold chart at Yahoo Finance, the ten-year yield on the ^TNX ticker, and the daily ETF flows on Farside. Wider market context lives on CoinDesk’s markets desk, and gold demand data at the World Gold Council.
Bitcoin is still here. It is simply no longer winning the comparison that made it interesting, and until it wins that back, calling it digital gold is a marketing line rather than a portfolio strategy.