Bitcoin’s Post-Midterm Stat Is Misleading. Here’s the Data.
Bitcoin’s most-cited number this week is a three-observation average that does not survive a simple recomputation. CoinDesk published an analysis this morning showing that, excluding the fringe 2010 midterm, Bitcoin has averaged a 53.7% gain in the 12 months after Election Day across the three meaningful U.S. midterms since 2009. Election Day is November 3, 2026. Traders are treating that number as a green light for the fourth one. We ran the same exercise on daily closes and got 42.4% instead. The gap between those figures is not the interesting part. The interesting part is what happens when you stop measuring endpoints and start measuring paths.
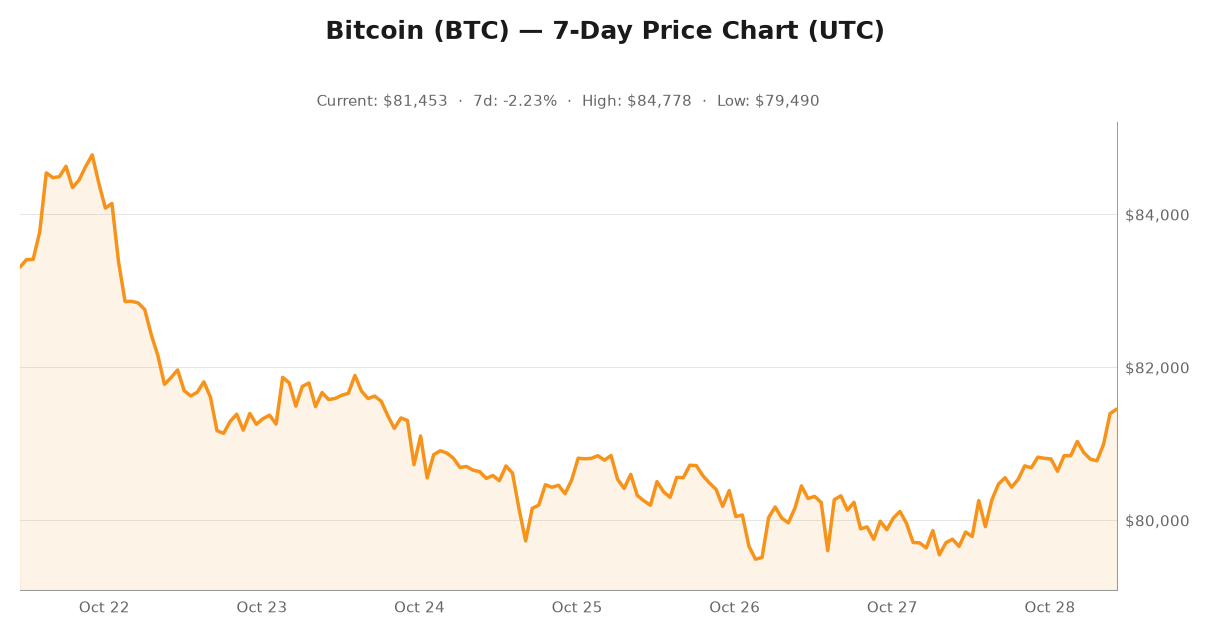
Here is the tape as of this morning: Bitcoin trades at $81,457, up 2.3% over 24 hours and roughly 39% above the $58,534 low it printed in late June. U.S. spot Bitcoin ETFs absorbed $176 million on Tuesday, a second straight day of inflows. The Federal Reserve is deciding on rates this week, and Bitcoin is hovering near $81,000 into that decision. Total crypto market cap sits at roughly $2.75 trillion, with Bitcoin dominance back at 59.5%. Every condition a momentum trader wants is in place, which is exactly why the statistic deserves a harder look before anyone positions for it.
What the 53.7% average actually contains
Three observations, not a sample
Using daily closes on Blockchain.com’s market price series, here is the full election-to-election-plus-12-months record for the three usable midterms:
- 2014 cohort: $326.49 on Election Day to $361.54 twelve months later = +10.7%
- 2018 cohort: $6,437.76 to $9,418.05 = +46.3%
- 2022 cohort: $20,598.44 to $35,035.12 = +70.1%
That simple average is +42.4%, against CoinDesk’s 53.7%. Both numbers come from reasonable methodologies, and the eleven-point gap between them is the point: the statistic is not a property of Bitcoin, it is a property of which method you picked.
Now make it fragile on purpose. Drop the weakest cohort and the average jumps to 58.2%. Drop the strongest and it collapses to 28.5%. A statistic that moves 30 points when you remove one of three data points is not a signal, it is a rounding artifact with a chart attached. Compare that with the S&P 500 version of the same idea, which is backed by a 75-year record: 15.17% average in the year after midterms against 7.30% in every other year. That one is a base rate. Bitcoin’s version is a scatter plot.
The endpoint hides the path
There is a second, quieter problem. A 12-month return says nothing about the middle of those 12 months, and in two of the three windows Bitcoin finished below its own in-window high:
- The 2014 window peaked at $420 in mid-November 2014 and closed its 12 months 14% below that high.
- The 2018 window peaked at $12,933 in late June 2019 and closed 27.2% below it.
- The 2022 window peaked at $35,441 and closed just 1.1% below it.
In the 2018 cohort, Bitcoin doubled inside the post-midterm year and still gave back more than a quarter of it by the end of the window. A “post-midterm rally” and a “bear market rally” are the same object photographed at two different zoom levels, and the annual statistic only shows you the zoomed-out frame.
The clock that actually drives the tape
CoinDesk’s own piece concedes the better explanation: the halving cycle, not politics. The last halving was April 2024, and the supply data from that halving is what actually sets the rhythm. Bitcoin peaked at $124,777 on October 7, 2025 — eighteen months later, the far edge of the 12-to-18-month band that has followed every halving. Today it is 35% below that high.
So the current post-midterm window sits inside what the cycle calls a post-peak year, with midterm years 2014, 2018, 2022 and now 2026 as the years the cycle spent trending down. The 53.7% statistic is not a forecast here. It is a coincident, lagging description of a cycle already halfway through. Trading it as a leading indicator is the mistake.
The bull case is real, and it is not the midterms
Now the other side, because the bears skip this part. The June low looks like a genuine cycle bottom, and the 2014 analogue is instructive for the wrong reason. Bitcoin bottomed in January 2015 at a $172 close, which made the 2014 midterm window look dead on an annual chart: +10.7%, indistinguishable from noise. It then closed 2017 at $19,280, more than 11,000% above that low. A flat twelve-month window is what a market bottom looks like on an annual chart.
Bitcoin today is roughly 39% off its late-June low, with $176 million of ETF inflows on Tuesday and a Fed catalyst on deck. That is a bottoming structure, not a top. If you are looking for a reason to be constructive into November, this is a better one than an election statistic with three data points behind it. The midterms may well be the narrative that sells the rally. They should not be the reason you bought it.
The security budget is a power market now, not a fee market
Fees pay for less than half a percent of it
Here is the variable almost nobody puts into cycle debates: who is paying for Bitcoin’s security. The answer in 2026 is emphatically not users. The subsidy pays out 3.125 BTC per block, or roughly 450 BTC a day, worth about $36.7 million at today’s price. Total transaction fees over the past 30 days averaged 653,726 satoshis per block, roughly 0.94 BTC a day, or about $77,000. The last seven days ran hotter at 1,267,128 satoshis per block, still less than 0.4% of miner revenue. The live mempool is so empty that every priority tier on mempool.space quotes one sat per virtual byte.
Bitcoin’s settlement layer is effectively free, so its security budget is set by a policy number and a power price rather than by user demand. Which is why the AI pivot matters more than it appears. Publicly traded miners have signed more than $70 billion in AI and high-performance computing contracts, according to CoinShares data cited by CoinDesk. Luxor raised $16 million to expand an AI hardware brokerage, with Canaan and MicroBT participating, and works with miners representing nearly two gigawatts of power capacity. NIP Group, meanwhile, is expanding mining capacity by about 48%.
Why the AI pivot cuts both ways
Here is the contrarian part: the AI pivot is bullish for hash rate and bearish for the cost of security. Bitcoin’s hash rate sits near 1,105 exahash per second, close to the record 1,245 EH/s set in November 2025, and the next difficulty retarget at block 973,728 is estimated to raise it another 6.4% because blocks are arriving roughly 15% slower than the ten-minute target. A 6.4% difficulty increase against a fee market contributing a fifth of one percent of revenue is a margin squeeze for the marginal fleet, and AI datacenters bidding for the same megawatts push power costs the wrong way. Bitcoin’s security is now priced in an AI power market, and that is a variable the post-midterm statistic knows nothing about.
What to actually watch before November 3
- ETF flows, not election polls. The marginal buyer in 2026 arrives through a securities wrapper. $176 million on Tuesday tells you more about the next month than any forecast of November 3 does.
- The difficulty retarget. Watch block 973,728 and the 6.4% increase. Difficulty is the real constraint on miner solvency, and it is the one number that can deteriorate quietly.
- Fee revenue and mempool congestion. At one sat per virtual byte there is no organic bid to cushion a risk-off move. A fee market that finally wakes up would be genuine confirmation of a healthier Bitcoin.
- Power and interconnection, not hash rate headlines. AI compute contracts are the new variable in miner balance sheets, in both directions.
- Positioning. A market priced for a clean post-midterm melt-up has no cushion for a 30-point error in a three-point average.
The bottom line
Bitcoin’s post-midterm average is a weak signal wearing a strong suit. Run it yourself and you get 42.4% instead of 53.7%, remove one cohort and it moves thirty points, and in two of three windows the rally was a bear-market rally in disguise. Meanwhile the cycle that actually sets the tape peaked at $124,777 in October 2025, the network’s fee market contributes less than half a percent of miner revenue, and the power bill is being written by AI datacenters. None of that says Bitcoin is going down. It says the election calendar is a narrative, not an engine, and the numbers worth tracking are ETF flows, difficulty, fee revenue and megawatts. Check the live Bitcoin market data and the on-chain numbers before you let a three-sample average make your decision for you.