Bitcoin Is Trading Like a High-Beta Stock, Not Digital Gold
Every few months someone re-runs the chart that supposedly proves Bitcoin is digital gold. Gold has a 5,000-year record as the asset that holds value when confidence in fiat wobbles. BTC has a fifteen-year record of doing roughly the opposite half the time. Yet the label keeps coming back, and every cycle it drags in a fresh wave of buyers who believe they are buying insurance.
As of November 4, 2026, the numbers make a stronger case than any narrative. I pulled two years of daily closes for Bitcoin, COMEX gold futures and the S&P 500 and ran the correlation and beta math myself. The result is not ambiguous. Over the trailing twelve months, its daily returns correlate with gold at just 0.19, while they correlate with the S&P 500 at 0.46. The 365-day beta to the S&P is 1.44. The beta to gold is 0.28.
Bitcoin is not behaving like gold. It is behaving like a leveraged, high-volatility equity, and the data is unambiguous about which one it is.
The correlation test nobody runs
Correlation is easy to get wrong by eyeballing charts. Daily returns over a matching window is the honest way to measure it. Here is what the trailing daily-return correlation looks like across multiple lookbacks:
- Bitcoin vs. gold, 90 days: +0.49
- Bitcoin vs. gold, 365 days: +0.19
- Bitcoin vs. gold, 700 days: +0.14
- Bitcoin vs. S&P 500, 30 days: +0.53
- Bitcoin vs. S&P 500, 365 days: +0.46
- Bitcoin vs. S&P 500, 700 days: +0.41
Read that gold line again. The 90-day number looks like it rescues the thesis, because the two have been moving together with a correlation near 0.5. But stretch the window to a year and it collapses to 0.19. Stretch it to two years and it falls to 0.14, barely better than two assets sharing nothing but a ticker symbol. Gold is the weaker relationship in every single window.
Meanwhile the S&P 500 correlation has been stubbornly positive across the two-year sample: 0.41 at two years, 0.46 at one year and 0.53 over the past month. If you want to know what this asset actually trades with, the answer is equities. Not bullion.
Sanity-check the inputs on CoinGecko’s Bitcoin market data, the sector breakdown at CoinGecko global charts, and the leverage layer in the funding and open interest data on CoinGlass.
The window that settles the argument
Correlations describe tendencies. If you want proof of what a drawdown actually is, look at what else was moving at the same time.
Bitcoin’s worst stretch of 2026 ran from January 14 to June 30. It fell from $96,929 to $58,559, a 39.6% drawdown, and the reason the asset still trades 37.2% below its $124,753 all-time high set on October 6, 2025.
Here is what gold and the S&P 500 did over that exact window:
- Bitcoin: -39.6%
- Gold: -12.9%
- S&P 500: +8.3%
The S&P 500 gained 8.3% while Bitcoin lost 39.6%. That is not a risk-off event. A genuine macro shock does not produce a 48-point spread between two assets the market simultaneously calls digital gold. What happened in the first half of 2026 was an idiosyncratic repricing, a crypto-specific unwind with nothing to do with the state of the world economy, because the equity market was busy making new highs while it unfolded.
Year to date the same split holds: Bitcoin is down 13.0% in 2026, gold is down 6.4%, and the S&P 500 is up 10.4%.
Volatility tells you what you are actually buying
Volatility tells you what you are signing up for, and on that measure the digital gold framing is even further off:
- Bitcoin, 365-day annualized volatility: 44.0%
- Gold, 365-day annualized volatility: 31.4%
- S&P 500, 365-day annualized volatility: 14.6%
Bitcoin is roughly 1.4 times as volatile as the metal it is supposed to replace and three times as volatile as the index. On a 90-day window its volatility is 38.7% against gold’s 26.0%. The tail behavior is worse than the standard deviation suggests: over the last two years there were 33 sessions with moves greater than 5%, and the two largest were -15.2% on February 5, 2026 and +11.8% the very next day.
That pair of days is the whole argument for owning this asset, honestly. Nobody buys Bitcoin because it is stable. It has never been stable. The stability of the digital gold story was never a property of the asset. It was a property of the marketing.
Gold broke too. Nobody mentioned it
Here is the part of the story that gets skipped. Gold itself is down 23.8% from its January 29, 2026 high of $5,318, and down 6.4% year to date. The supposed safe haven took a bigger percentage hit than the leading crypto asset did in 2026.
That matters for the hedge argument. If gold and BTC were both functioning as inflation hedges, they should have moved together when inflation expectations shifted. They did not. Gold’s drawdown was 12.9%, the crypto drawdown was 39.6%, and they run at a 0.19 correlation over a year. Two assets claiming the same job and failing at it independently is a strong hint that neither is doing the job investors think.
What was actually repricing the market
So what repriced Bitcoin if not the macro environment? Look at the network and the answer is a supply and flow story rather than a macro one.
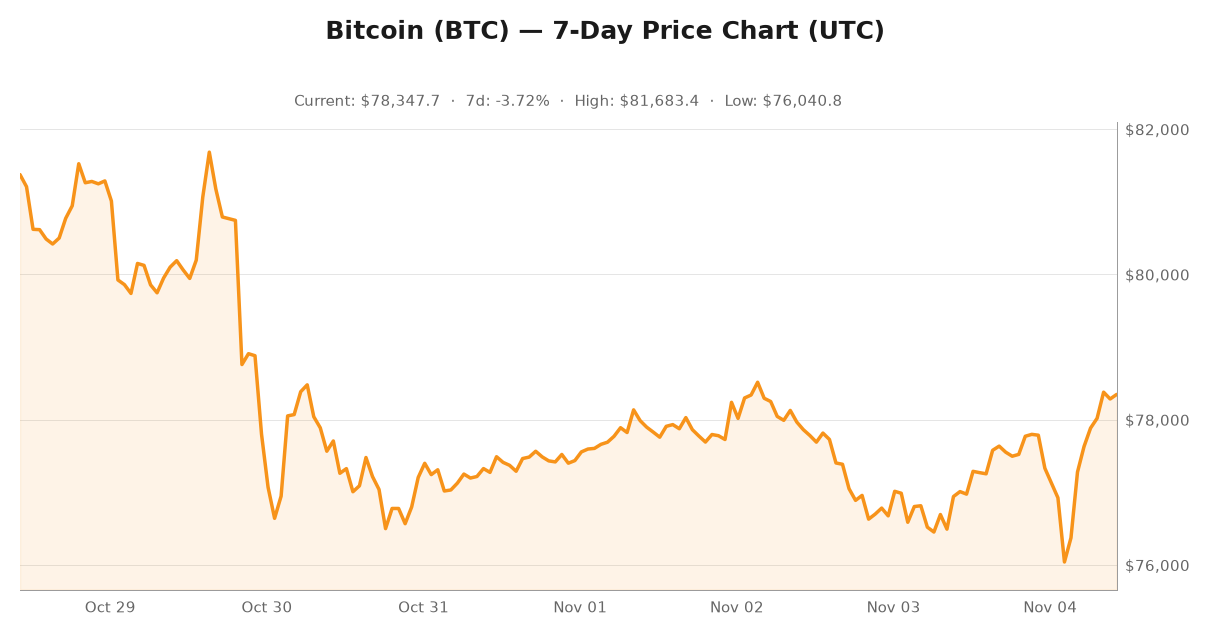
Mining security kept expanding. Average hash rate over the last three months sits at 963 EH/s, with the most recent reading at 1,034 EH/s, up 10.5% in 30 days even with Bitcoin trading near $78,000 and having visited $75,700 earlier this week. Difficulty’s previous retarget came in at +5.54%, with the next adjustment projected at -2.59%. Miners are not capitulating. Capital is still committing to hashing the chain at prices 37% below the peak. Watch it live on mempool.space network graphs.
The fee market remains nearly free. The minimum relay fee right now is 1 sat/vB and the fastest fee is 2 sat/vB. Security spending is being funded almost entirely by the block subsidy, which means miner revenue is more subsidy-dependent than ever, and no amount of institutional flow changes that in 2026.
On-chain throughput is up 64% while price fell. Daily confirmed transactions averaged 423,281 in the first quarter of 2026 and 695,954 in the most recent quarter, a 64.4% increase, with the latest reading at 642,252. The network is being used more heavily this year than last even as its price went the other direction. One caveat: raw counts include batched transfers and can be inflated by dust spam, so treat this as directional. The direction is hard to argue with, and it points to real settlement demand rather than speculative churn.
Supply is fixed and the market is concentrated. 33,503,866 Bitcoin exist. Total crypto market cap is $2.62 trillion, with Bitcoin at 59.95% dominance. No new supply arrives, and roughly three-fifths of the sector’s value sits in one asset. That concentration cuts both ways, and in 2026 it amplified the downside.
Where the recovery comes from
There is a genuinely bullish fact buried here, and it is not a price fact. Over the last 90 days Bitcoin is up 21.8%, from $64,262 to $78,286. Over the identical window gold fell 5.7% and the S&P 500 fell 1.8%. It rallied while both of its supposed correlations went the other way.
That is what idiosyncratic strength looks like. It is also what a beta-1.44 equity-like asset looks like when risk appetite returns. Whether the bid comes from allocators or short covering in the derivatives market is a separate question that Cointelegraph’s Bitcoin coverage has tracked all year. Either way, the rally is not a gold story.
What to do with this
- Stop sizing Bitcoin as an inflation hedge. At a 0.19 one-year correlation to gold and 44% annualized volatility, it occupies the risk budget of a high-beta growth asset. If you are buying it as insurance, you are buying the wrong insurance at the wrong price.
- Watch the 90-day correlation for a reason. At +0.49, the two have been moving together over the past quarter, the most gold-like reading in two years, and it will tempt people to declare victory for the digital gold thesis. It is also the number most likely to mean-revert.
- Track the network’s own plumbing, not the macro tape. Hash rate at 1,034 EH/s and rising, fees at 1 to 2 sat/vB, and daily transactions up 64.4% year to date are the fundamentals here. The daily moves of the S&P 500 are noise for this asset.
- Size for 15% days. The market logged a -15.2% session in February and a +11.8% session the next day. Any position that survives only the average day will not survive the actual distribution.
The bottom line
The digital gold label has been wrong for most of this asset’s existence, but it was always a story rather than a measurement. In late 2026 the measurement finally exists, and it is not close: 0.19 correlation to gold, 0.46 to the S&P, a 1.44 beta to equities, 44% annualized volatility, and a 39.6% drawdown that happened while the S&P 500 gained 8.3%.
That is not bad news for Bitcoin. It is a description of what this asset is: scarce, fixed-supply, high-volatility, with its own supply and demand curve, doing its own thing for its own reasons. The buyers who do well are not the ones who bought it as gold. They are the ones who bought it as a risk asset and did the math.
Bitcoin is up 21.8% over the last 90 days while gold and stocks both declined. Whatever this is, it is not trading like bullion. The data settles it, and the data is not ambiguous.