
Key points:
XRP struggles to break above the $2.35 resistance, pointing to a lack of demand at higher levels.
Rising odds of an XRP ETF approval could catalyze the next leg of a XRP rally.
Bloomberg’s exchange-traded fund specialists Eric Balchunas and James Seyffart project a 95% possibility of XRP (XRP), Solana (SOL), and Litecoin (LTC) ETFs being greenlit by the US Securities and Exchange Commission in 2025.
Could XRP’s price consolidation act as a launch pad for the next move higher, or will the bears pull the price lower? Let’s analyze the charts to find out.
XRP price prediction
Buyers pushed XRP above the 50-day simple moving average ($2.24) on Monday, but the long wick on the candlestick shows selling at higher levels.
The 20-day exponential moving average ($2.17) is the key level to watch out for in the near term. If the price rebounds off the 20-day EMA with force, it increases the likelihood of a break above the $2.35 resistance. If that happens, the XRP/USDT pair may surge to $2.65.
Contrarily, if the price breaks and maintains below the 20-day EMA, it signals that the bears are trying to seize control. The pair could slide to $2.06 and later to $2. Buyers are expected to defend the $2 level with all their might because a close below it opens the doors for a fall to $1.61.
Related: XRP price predictions above $3 in 2025 have one major flaw
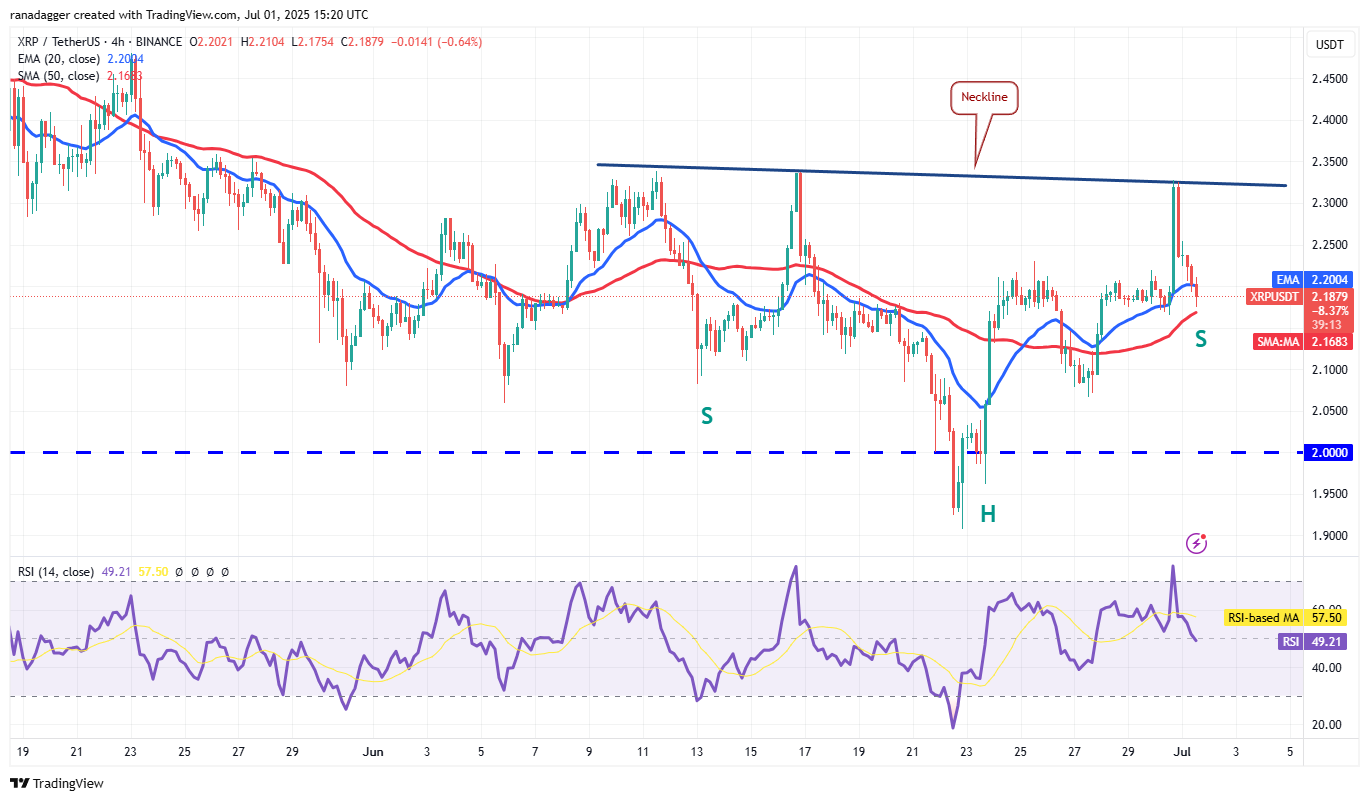
The 4-hour chart shows that the bears are fiercely defending the $2.35 level. There is support at the 50-SMA, but if the bears prevail, the pair could drop to $2.06. This is a critical level for the bulls to defend because a break below $2.06 may sink the pair to $2.
On the contrary, if the price turns up from the 50-SMA, the bulls will try to push the pair to the neckline of the inverse head-and-shoulders pattern. A break and close above the neckline completes the bullish setup, which has a target objective of $2.76.
This article does not contain investment advice or recommendations. Every investment and trading move involves risk, and readers should conduct their own research when making a decision.