
Key point:
Bitcoin (BTC) has been consolidating after hitting the all-time high of $123,218. Although BTC has not given up much ground, its falling dominance of the total crypto market capitalization shows that money is flowing into altcoins.
Will Sui (SUI) be one of the beneficiaries this altseason? Let’s analyze the charts to find out.
SUI price prediction
SUI picked up momentum after breaking above the 50-day simple moving average (SMA) ($3.10) on July 10.
The up move has reached near the overhead resistance of $4.30, where the sellers are expected to mount a strong defense. There is support at $3.81 and then at the 20-day exponential moving average (EMA) ($3.37). If the price rebounds off the 20-day EMA, the bulls will again attempt to drive the SUI/USDT pair above $4.30. If they manage to do that, the pair could surge to $5 and eventually to $5.37.
This optimistic view will be negated in the near term if the price turns down and breaks below the 20-day EMA. That suggests the bulls are losing their grip. The pair may then drop to the 50-day SMA.
Related: 3 charts scream ‘It’s altcoin season’ as Bitcoin dominance hits 8-week lows
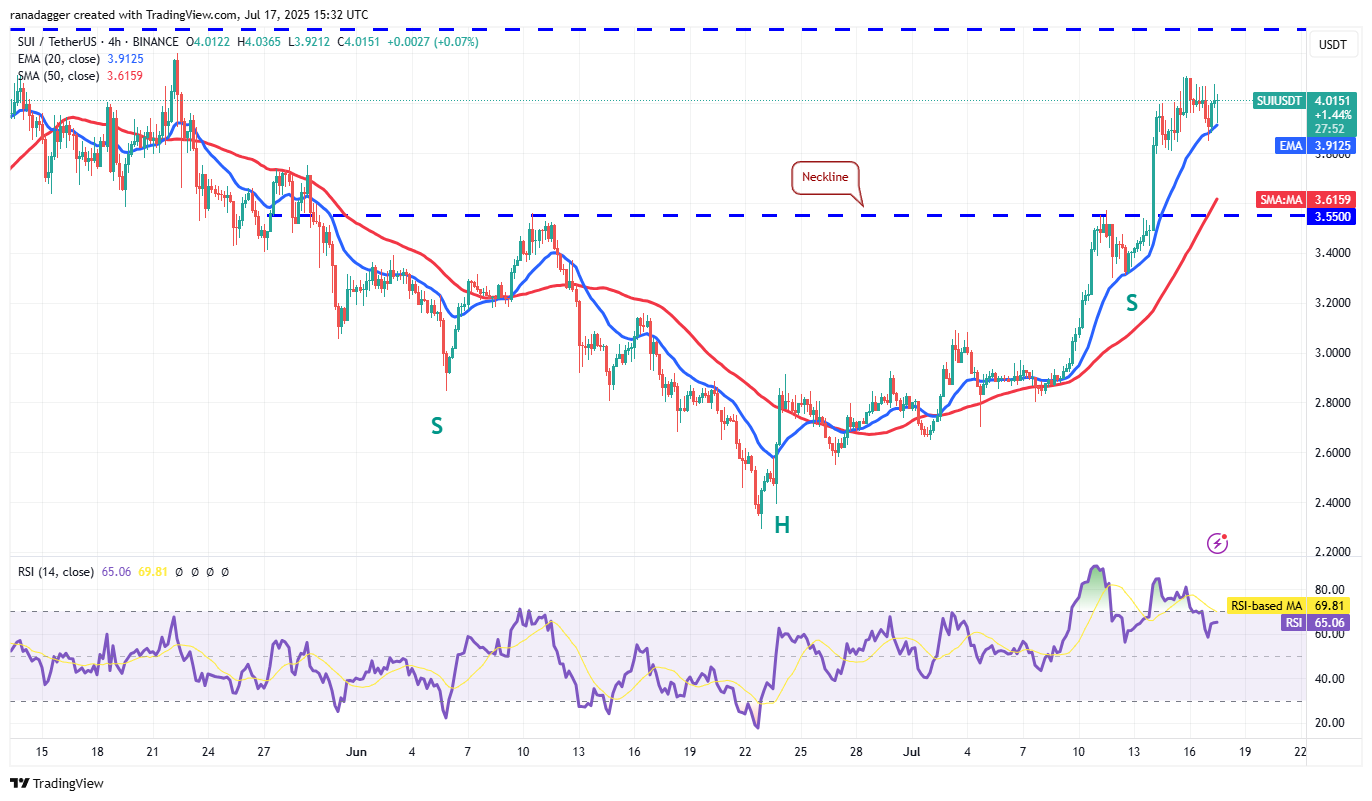
The pair completed a bullish inverse head-and-shoulders pattern on a close above the $3.55 level. Sellers are trying to halt the rally at $4.10, but the bounce off the 20-EMA on the 4-hour chart indicates a positive sentiment. The pair could rally to $4.30, which may act as stiff resistance.
Sellers will have to tug the price below the breakout level of $3.55 to gain the upper hand. The pair may then tumble to $3.30 and later to $3.
This article does not contain investment advice or recommendations. Every investment and trading move involves risk, and readers should conduct their own research when making a decision.